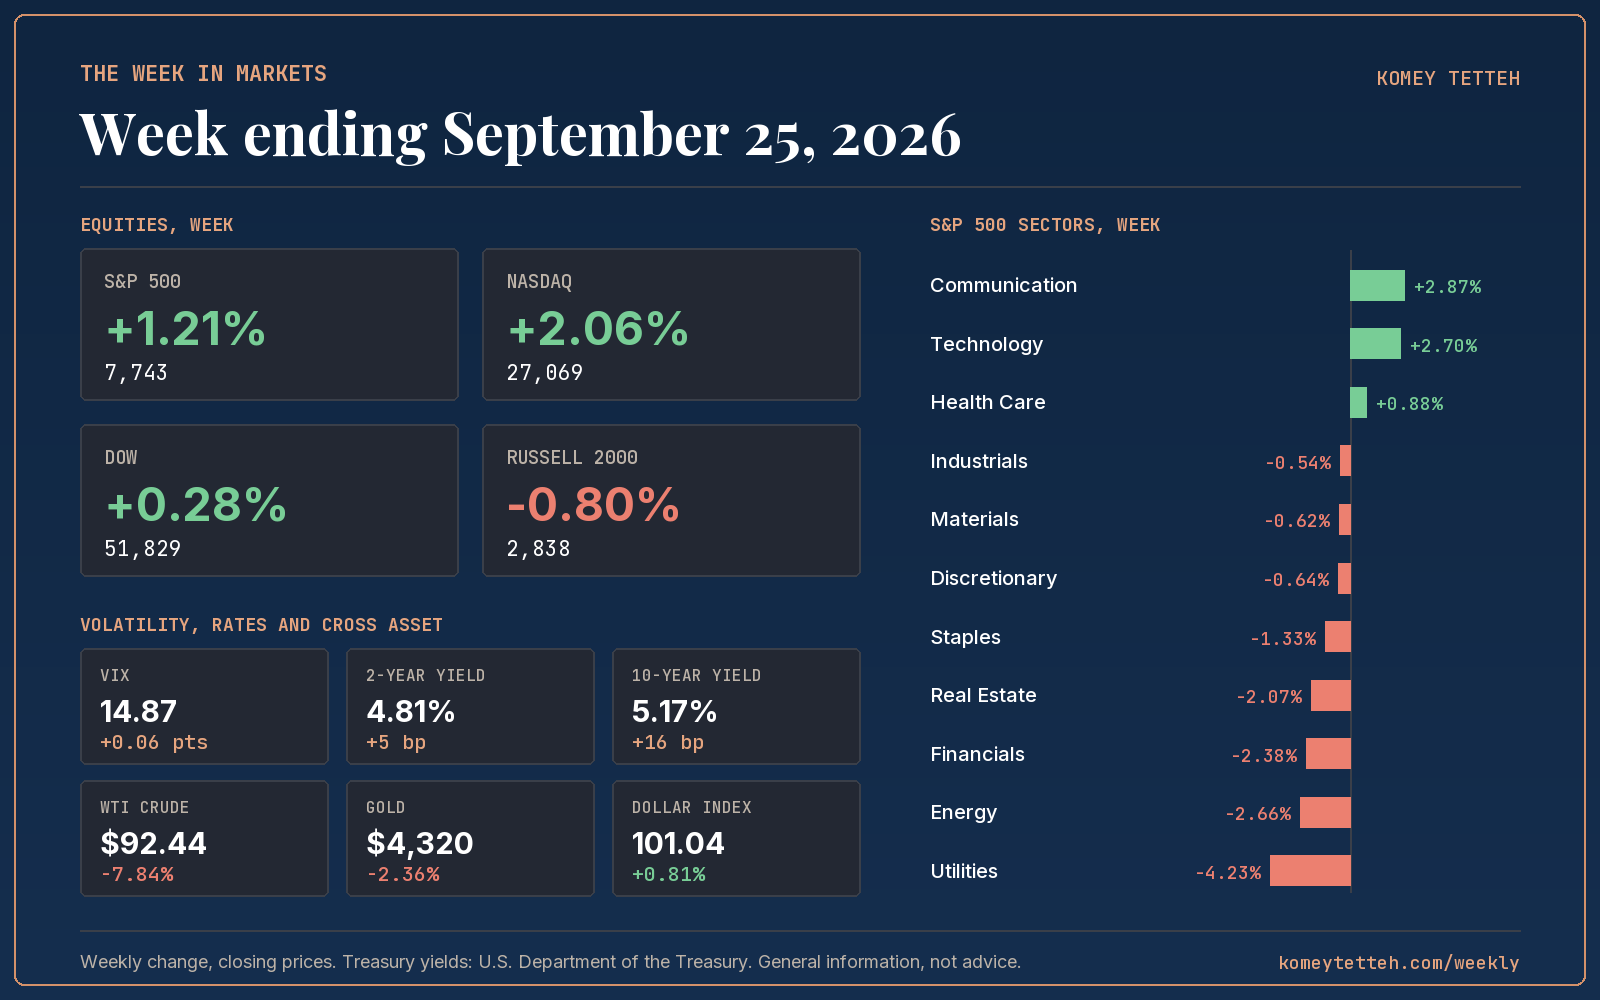
- The S&P 500 gained 1.21% to close at 7,743, while the Nasdaq Composite outpaced it with a 2.06% advance.
- The 10-year Treasury yield rose 16 basis points to 5.17%, a level not seen in roughly two decades.
- Utilities fell 4.23% and Financials fell 2.38%, the week's two weakest sectors, both classic casualties of higher yields.
- WTI crude dropped 7.84% to $92.44 on signs of Iran-related de-escalation, while gold slipped 2.36% to $4,320.
- The VIX ended the week at 14.87, almost unchanged from 14.81 a week earlier.
What moved markets
The bond market set the tone, not stocks
The 10-year yield climbed 16 basis points to 5.17%, a level not seen in roughly two decades, and the 30-year followed to 5.49%, its highest since 2004. The move followed a hot August CPI print and hawkish commentary from officials including Musalem, Collins, Barkin and Warsh, all pointing toward another possible rate increase. Higher discount rates hit rate-sensitive sectors hardest: Utilities lost 4.23% and Financials 2.38%, while Real Estate fell 2.07%.
Equities absorbed the pressure without a directional break. The S&P 500 dipped to 7,706 midweek as yields spiked, then recovered into Thursday and Friday. Finishing higher on the week despite a fresh multi-decade high in long-end yields suggests the market is treating this as a rates story, not a growth scare.
Tech and Communication Services carried the index
Communication Services led all sectors with a 2.87% gain and Technology followed at 2.70%, together doing most of the work behind the S&P 500's advance. Microsoft added roughly 4% late in the week after an analyst raised expectations tied to its enterprise software pivot, contributing meaningfully to the Dow's gain on its own, a reminder that index-level calm can mask real dispersion underneath.
Energy and gold reversed on Iran signals
WTI crude fell 7.84% to $92.44, and Energy finished down 2.66%. The catalyst was geopolitical: signs that Iran was willing to reopen negotiations pulled crude lower and eased a risk premium built over Strait of Hormuz tension earlier in the week. Gold slipped 2.36% to $4,320 and the dollar index rose 0.81% to 101.04, both consistent with cooling safe-haven demand.
The volatility read
Options priced a one-week move of about 2.05% for the S&P 500, based on the prior week's VIX close of 14.81. The index delivered 1.21%, roughly 0.59 times what was implied, despite a 19-year high in the 10-year yield and a week of hawkish Fed commentary.
Realised volatility over the five sessions, annualised, came in at 13.1%, below the 14.87 VIX level at week's end, and the high to low range across the week was only 1.56%. Two sessions closed effectively flat at the index level while masking real intraday round trips, including a bond-market swing that pulled the index lower before it clawed the loss back by the close. That pattern, index calm sitting on top of real intraday movement, is exactly what a delta-neutral book watches for: dealers were not paying up for protection even as the macro backdrop generated genuine two-way risk.
The honest counter is that the VIX barely moved all week, ending at 14.87 versus 14.81 seven days earlier, even as the 10-year gained 16 basis points to a multi-decade high. If implied vol were mispricing the situation, the gap between realised and implied would likely widen rather than stay compressed near 13% to 15%. For now, options are treating the rates move as an orderly repricing rather than a shock, and whether that holds depends on how the next round of data lands.
The scorecard
Equities
| Index | Close | Week | Year to date |
|---|---|---|---|
| S&P 500 | 7,743 | +1.21% | +13.12% |
| Nasdaq Composite | 27,069 | +2.06% | +16.46% |
| Dow Jones Industrial Average | 51,829 | +0.28% | +7.83% |
| Russell 2000 | 2,838 | -0.80% | +14.33% |
Volatility, rates and cross asset
| Market | Close | Week |
|---|---|---|
| VIX | 14.87 | +0.06 pts |
| 2-year Treasury | 4.81% | +5 bp |
| 10-year Treasury | 5.17% | +16 bp |
| 30-year Treasury | 5.49% | +15 bp |
| WTI crude | $92.44 | -7.84% |
| Gold | $4,320 | -2.36% |
| US dollar index | 101.04 | +0.81% |
S&P 500 sectors
| Sector | Week | Year to date |
|---|---|---|
| Communication Services | +2.87% | -3.17% |
| Technology | +2.70% | +35.24% |
| Health Care | +0.88% | +9.74% |
| Industrials | -0.54% | +8.84% |
| Materials | -0.62% | +9.55% |
| Consumer Discretionary | -0.64% | -7.61% |
| Consumer Staples | -1.33% | +5.18% |
| Real Estate | -2.07% | +3.22% |
| Financials | -2.38% | -0.44% |
| Energy | -2.66% | +40.01% |
| Utilities | -4.23% | -7.80% |
Volatility lens
| Measure | Value |
|---|---|
| Implied one-week move at the start of the week | 2.05% |
| Actual S&P 500 move, absolute | 1.21% |
| Actual as a multiple of implied | 0.59x |
| Realised volatility, annualised, 5 sessions | 13.1% |
| S&P 500 high to low range | 1.56% |
The week ahead
- Tuesday, September 29JOLTS job openings and Case-Shiller home pricesif job openings soften further, it feeds the debate over whether the Fed's hawkish tone this week matches a cooling labor market.
- Wednesday, September 30ADP employment report and final Q2 GDP estimatea weak ADP print ahead of Friday's payrolls could pressure the front end of the curve if it clashes with rate-hike odds already priced.
- Thursday, October 1ISM manufacturing index and weekly jobless claimsmanufacturing data has been a swing factor for Industrials and Materials, both already lagging this week.
- Friday, October 2September jobs report and average hourly earningspayrolls sit at the center of whether the long end keeps climbing toward multi-decade highs or the rate-hike narrative loses conviction.
Common questions
Why did the S&P 500 rise this week even as bond yields hit a 19-year high?
The index gained 1.21% because strength in Technology and Communication Services, plus easing Middle East tension that pulled oil prices down, offset pressure from a 16 basis point jump in the 10-year Treasury yield.
What happened to volatility this week?
The VIX ended the week at 14.87, almost unchanged from 14.81 seven days earlier, even though the S&P 500 swung through a bond market selloff and a partial recovery. Realised volatility over the week came in at 13.1% annualised, below where implied volatility finished.
What is the next major economic release?
The September jobs report, including average hourly earnings, is scheduled for Friday, October 2, following ISM manufacturing data and ADP's employment report earlier in the week.
Index, sector, commodity and currency figures are compiled from public closing prices. Treasury yields are from the U.S. Department of the Treasury daily par yield curve. The implied one-week move is the VIX close before the week began divided by the square root of 52, a common approximation. Commentary by Komey Tetteh.