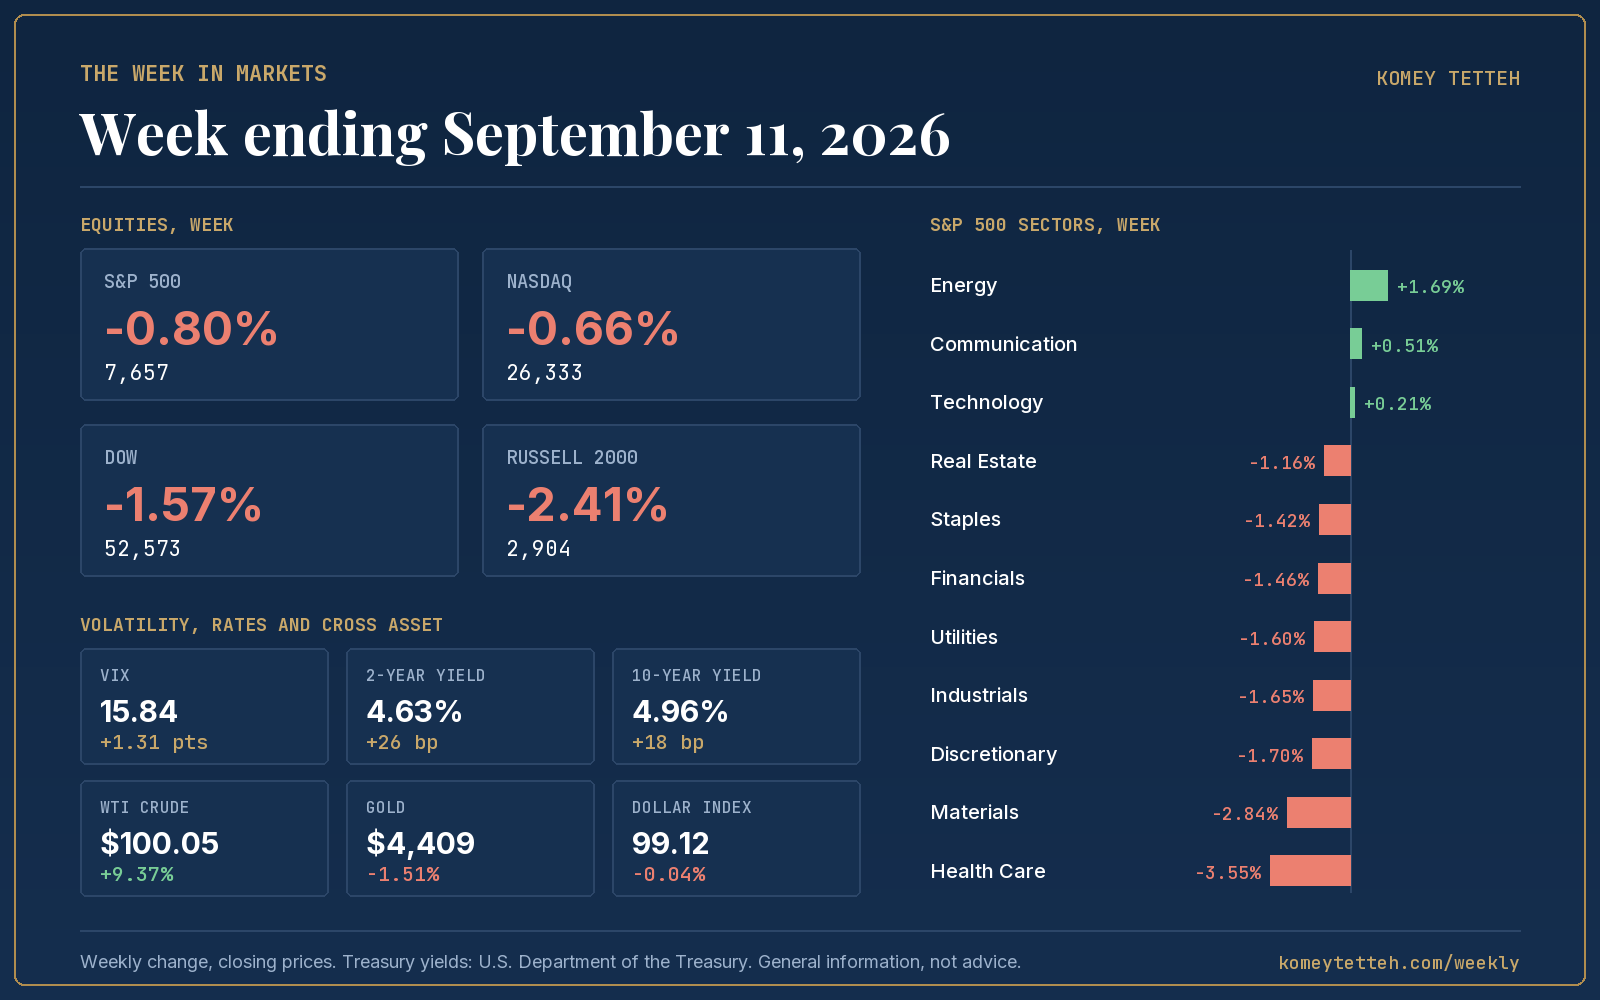
- The S&P 500 fell 0.80% on the week to 7,657, still up 11.85% year to date.
- The Russell 2000 led losses among major indices, down 2.41%, while the Dow slipped 1.57%.
- WTI crude jumped 9.37% to $100.05, the single biggest driver of the week's rate repricing.
- The 2-year yield rose 26 basis points to 4.63% as markets priced a higher probability of a Fed rate hike.
- The VIX rose from 14.53 to 15.84 even as the index move stayed well inside what options had priced.
What moved markets
Crude oil became the week's Fed proxy
Crude climbed 9.37% to $100.05 on escalating Middle East tensions, and every basis point of that move fed straight into the rate debate. A barrel above $100 revives the inflation math that keeps a policy tightening on the table, and the market treated it that way: the 2-year yield rose 26 basis points to 4.63%, the 10-year added 18 to 4.96%, and the 30-year moved 11 to 5.35%. That is a bear-flattening signature, front-end yields moving more than the long end, which is what happens when markets reprice the near-term policy path rather than long-run growth or inflation expectations.
The mechanism cut both ways by Friday. Crude eased off its highs into the session, and equities used that relief to rally even against a hotter-than-expected inflation print, because the oil move mattered more to the tape than the data itself. That is the clearest sign all week of what was actually driving price action: not the calendar of releases, but the commodity behind them.
Small caps and rate-sensitive sectors absorbed the damage
The selloff was not uniform. The Russell 2000 dropped 2.41%, more than three times the S&P 500's decline, consistent with a small-cap complex that carries more floating-rate debt and less pricing power against a rising-rate backdrop. Health Care was the worst-performing sector at -3.55%, followed by Materials at -2.84%, Consumer Discretionary at -1.70% and Industrials at -1.65%. Energy was the standout gainer at +1.69%, the direct beneficiary of the crude move that pressured everything else.
Financials fell 1.46% and Utilities 1.60%, both consistent with a market pricing tighter policy and higher-for-longer funding costs. Technology and Communication Services were the relative shelters, up 0.21% and 0.51% respectively, helped by strength in networking and semiconductor names that offset softness elsewhere in the growth complex.
Gold and the dollar stayed on the sidelines
Gold fell 1.51% to $4,409 even as inflation pressure built, a reminder that gold trades the real-rate story as much as the inflation story, and rising nominal yields with rising hike odds pushed real yields higher too. The dollar index was essentially flat, down 0.04% to 99.12, suggesting the rate repricing was read as a domestic Fed story rather than a broader dollar-strength trade.
The volatility read
Options walked into the week pricing a one-week move of 2.01% for the S&P 500, derived from the prior week's VIX close of 14.53 scaled down to a weekly window. The index delivered an absolute move of 0.80%, only 0.40 times what implied volatility had priced. Realised volatility across the week's four sessions annualised to 11.2%, and the full high-to-low range was just 1.82%. By any measure, the options market overpaid for the risk that actually showed up in the index.
That gap matters because it did not come from a quiet week. Crude spiked through $100, yields moved sharply across the curve, and a hot inflation print landed two trading days before a live Fed decision. Every one of those inputs argued for a wider index range than the market got. What happened instead is that the volatility showed up inside sectors and single names, Health Care down 3.55%, ServiceTitan down 30% on guidance, CooperCompanies down roughly 15%, rather than at the index level. Dispersion did the work that index-level volatility did not.
The VIX itself told a related story: it rose 9% on the day of the hot wholesale inflation print even though the index only fell 0.58% that session, then gave back 11.3% on Friday as the index rallied 0.86%. That pattern, implied volatility moving more than realised, is a market treating the coming week's binding event, the Fed decision, as the real source of risk, and treating the current week's data prints as noise to be absorbed rather than repriced. Whether that is complacency or well-calibrated patience depends entirely on what the Fed delivers next week.
The scorecard
Equities
| Index | Close | Week | Year to date |
|---|---|---|---|
| S&P 500 | 7,657 | -0.80% | +11.85% |
| Nasdaq Composite | 26,333 | -0.66% | +13.30% |
| Dow Jones Industrial Average | 52,573 | -1.57% | +9.38% |
| Russell 2000 | 2,904 | -2.41% | +17.00% |
Volatility, rates and cross asset
| Market | Close | Week |
|---|---|---|
| VIX | 15.84 | +1.31 pts |
| 2-year Treasury | 4.63% | +26 bp |
| 10-year Treasury | 4.96% | +18 bp |
| 30-year Treasury | 5.35% | +11 bp |
| WTI crude | $100.05 | +9.37% |
| Gold | $4,409 | -1.51% |
| US dollar index | 99.12 | -0.04% |
S&P 500 sectors
| Sector | Week | Year to date |
|---|---|---|
| Energy | +1.69% | +45.69% |
| Communication Services | +0.51% | -4.35% |
| Technology | +0.21% | +30.35% |
| Real Estate | -1.16% | +7.61% |
| Consumer Staples | -1.42% | +7.34% |
| Financials | -1.46% | +4.53% |
| Utilities | -1.60% | -0.70% |
| Industrials | -1.65% | +11.12% |
| Consumer Discretionary | -1.70% | -5.40% |
| Materials | -2.84% | +12.35% |
| Health Care | -3.55% | +6.82% |
Volatility lens
| Measure | Value |
|---|---|
| Implied one-week move at the start of the week | 2.01% |
| Actual S&P 500 move, absolute | 0.80% |
| Actual as a multiple of implied | 0.40x |
| Realised volatility, annualised, 4 sessions | 11.2% |
| S&P 500 high to low range | 1.82% |
The week ahead
- Wednesday, September 16FOMC rate decision at 2:00 p.m. ETIf the hike priced into markets this week is delivered, the front end of the curve has already done most of the repricing; if the Fed holds instead, the unwind in short-dated yields could be the more consequential move.
- Friday, September 18Monthly options expirationExpiring monthly options can add mechanical flow to whatever direction the market is already leaning, amplifying moves in either direction around the Fed decision.
- Friday, September 18Quarterly expiration of index futures and optionsQuarterly expiry landing two days after a live FOMC decision concentrates positioning risk into a single session, a setup where dealer hedging flows can matter as much as the news itself.
Common questions
Why did the stock market fall this week?
The S&P 500 fell 0.80% for the week as crude oil surged 9.37% to $100.05 on Middle East tensions, reviving inflation concerns and pushing Treasury yields sharply higher across the curve. Small caps and rate-sensitive sectors like Health Care and Financials absorbed most of the damage, while Energy was the only sector to post a solid gain.
What is the Fed expected to do at its September meeting?
The Federal Reserve's rate decision is scheduled for Wednesday, September 16 at 2:00 p.m. ET. Markets have been pricing a meaningful probability of a rate hike this week, but the outcome is not certain, and the decision itself, not any single data print, is the binding event for markets.
Why did volatility fall even after a volatile week for oil and yields?
The VIX ended the week at 15.84, and while it spiked intraweek on hot inflation data, it gave back those gains on Friday as crude eased and equities rallied. Options had priced a weekly move of about 2.01% for the S&P 500, but the index only moved 0.80%, showing implied volatility overstated the risk that materialized at the index level even as individual sectors and stocks saw sharp moves.
Index, sector, commodity and currency figures are compiled from public closing prices. Treasury yields are from the U.S. Department of the Treasury daily par yield curve. The implied one-week move is the VIX close before the week began divided by the square root of 52, a common approximation. Commentary by Komey Tetteh.