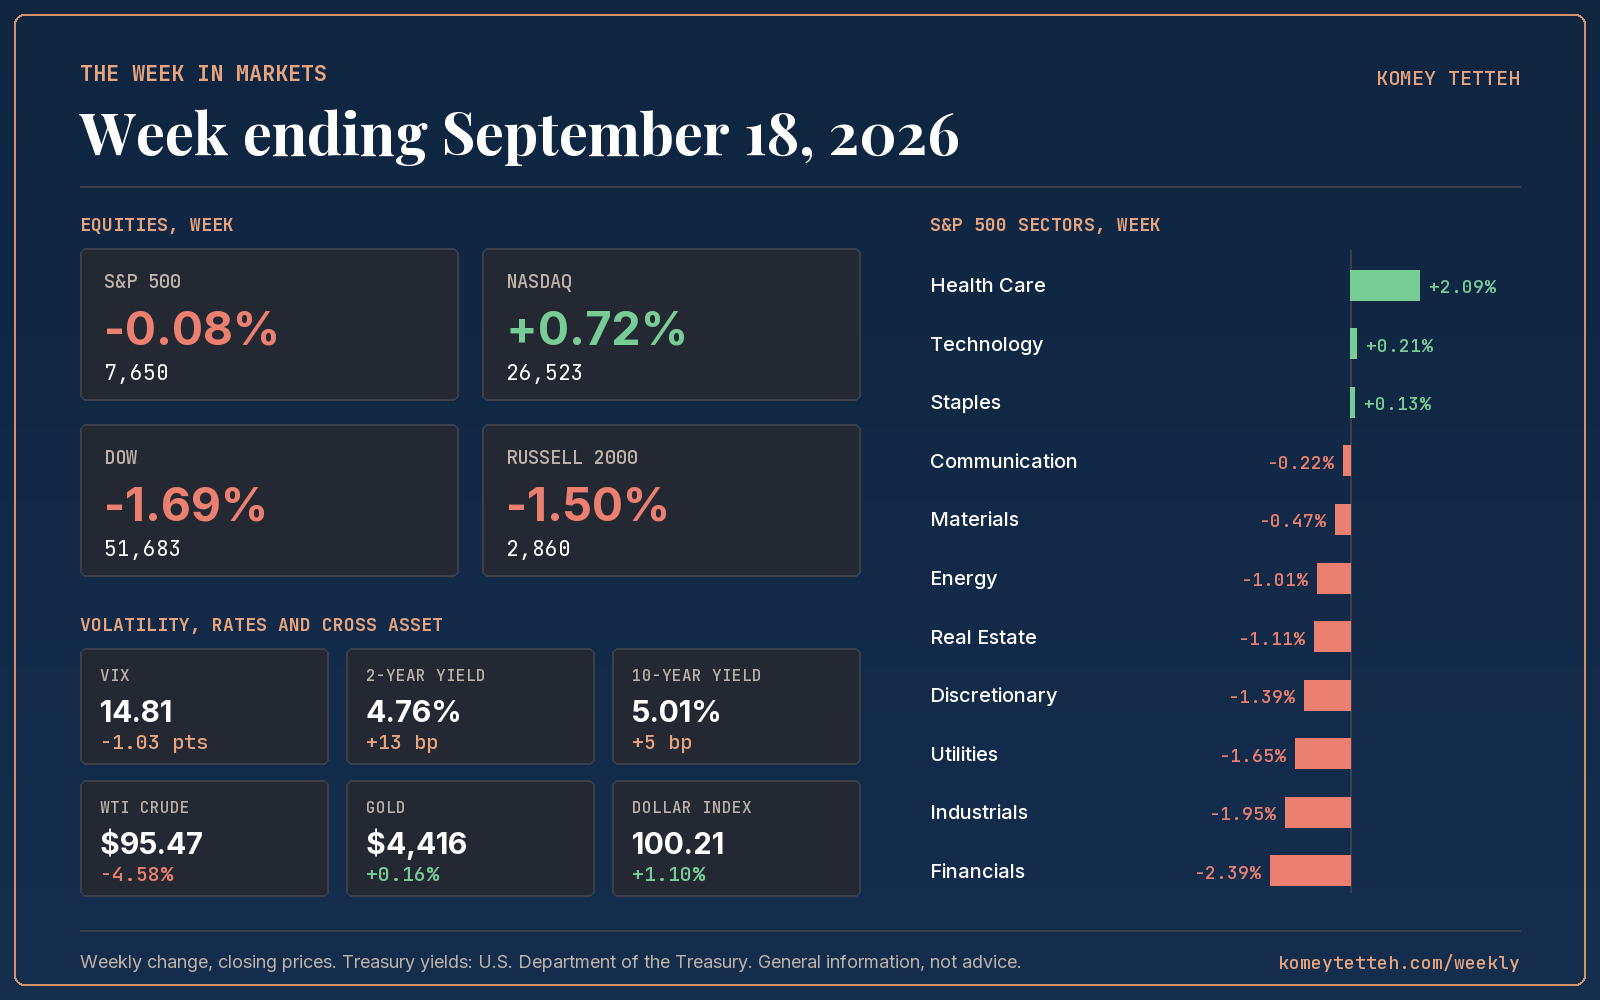
- The S&P 500 closed at 7,650, down just 0.08% for the week, despite a Federal Reserve rate hike and a 10-year yield near 5%.
- The Nasdaq Composite gained 0.72% while the Dow Jones Industrial Average fell 1.69% and the Russell 2000 dropped 1.50%, a sharp large-cap tech versus cyclical split.
- The VIX eased to 14.81 from 15.84 a week earlier even as realised volatility spiked around the Fed decision and quarterly expiration.
- The 2-year yield jumped 13 basis points to 4.76% and the 10-year rose 5 basis points to 5.01%, while the dollar index climbed 1.10% to 100.21.
- Financials led sector losses at -2.39% and Health Care led gains at +2.09%, with WTI crude falling 4.58% to $95.47.
What moved markets
The Fed hikes, and the tape does not break
The Federal Reserve raised its target range by 25 basis points to 3.75% to 4%, the first increase in three years. Officials signaled more may follow, with the bulk of the committee penciling in at least one additional hike this year. The decision came after an August inflation print that failed to cool enough to change the committee's mind, and policymakers used language pointing to inflation running above target.
The index reaction was smaller than the headline suggested. The S&P 500 fell on the decision day itself, then recovered most of that move the following session as chip stocks led a rebound and yields eased back from their intraday highs. By the close on September 18, the S&P 500 sat at 7,650, essentially unchanged from where it started the week, even though the 10-year yield had traded above 5% for the first time since 2007 during the week.
Financials and industrials pay the rate bill, tech does not
The sector dispersion this week told the real story. Financials fell 2.39%, the weakest sector, alongside Industrials at -1.95% and Utilities at -1.65%, all groups sensitive to the level and direction of interest rates. Technology, by contrast, added 0.21% and helped carry the Nasdaq Composite to a 0.72% weekly gain. Health Care topped the sector table at +2.09%.
That split explains the gap between the Dow, down 1.69% for the week, and the Nasdaq's advance. Rate-sensitive cyclicals absorbed the tightening while a handful of large technology names, some carrying single-stock catalysts around data center demand and chip pricing, kept the broader tape afloat.
Oil falls as the geopolitical premium unwinds
WTI crude dropped 4.58% on the week to $95.47, a sharp reversal after supply disruption fears had pushed prices well above $100 earlier in the period. Energy was the second-weakest sector at -1.01% as the retreat in crude took away the one sector that had been offsetting rate pressure elsewhere. Gold held largely steady, up 0.16% to $4,416, even as the dollar index rose 1.10% to 100.21, a combination that points to safe-haven demand persisting alongside a firmer currency rather than the two trading as usual opposites.
The volatility read
Options went into the week pricing a one-week move of 2.20% for the S&P 500, derived from the prior week's VIX close. That is a large number for a week containing a Fed decision and a quarterly expiration, and it reflected the uncertainty embedded in rates trading above 5% for the first time since 2007 and a hike whose outcome was not settled in the market's pricing until it happened. The index delivered an absolute move of just 0.08%, roughly 0.04 times what was priced. Realised volatility over the five sessions annualised at 11.1%, a fraction of what the implied number was signaling.
The gap is not a story of nothing happening. The week contained a 44 basis point decline on the Fed day, a 114 basis point rebound the next session, and a high to low range of 1.99%, itself well inside what was implied but far from quiet under the surface. What collapsed was net directional risk, not realised movement. Buyers of that opening week's volatility were compensated for a macro event that ultimately round-tripped: the market treated the hike as inflation resolve rather than a threat to growth, and priced accordingly by the time Thursday's expiration cleared.
The VIX ending the week at 14.81, down from 15.84, confirms that the options market marked the event as resolved rather than as an opening chapter. That leaves a thinner volatility risk premium heading into a stretch with fewer scheduled catalysts, which raises the stakes for any single data surprise. When implied volatility compresses this quickly after a hike with more increases signaled, the pricing question becomes whether the market has judged the tightening cycle correctly, not whether the past week was calm.
The scorecard
Equities
| Index | Close | Week | Year to date |
|---|---|---|---|
| S&P 500 | 7,650 | -0.08% | +11.76% |
| Nasdaq Composite | 26,523 | +0.72% | +14.11% |
| Dow Jones Industrial Average | 51,683 | -1.69% | +7.53% |
| Russell 2000 | 2,860 | -1.50% | +15.25% |
Volatility, rates and cross asset
| Market | Close | Week |
|---|---|---|
| VIX | 14.81 | -1.03 pts |
| 2-year Treasury | 4.76% | +13 bp |
| 10-year Treasury | 5.01% | +5 bp |
| 30-year Treasury | 5.34% | -1 bp |
| WTI crude | $95.47 | -4.58% |
| Gold | $4,416 | +0.16% |
| US dollar index | 100.21 | +1.10% |
S&P 500 sectors
| Sector | Week | Year to date |
|---|---|---|
| Health Care | +2.09% | +9.05% |
| Technology | +0.21% | +30.62% |
| Consumer Staples | +0.13% | +7.48% |
| Communication Services | -0.22% | -4.56% |
| Materials | -0.47% | +11.82% |
| Energy | -1.01% | +44.22% |
| Real Estate | -1.11% | +6.42% |
| Consumer Discretionary | -1.39% | -6.72% |
| Utilities | -1.65% | -2.34% |
| Industrials | -1.95% | +8.95% |
| Financials | -2.39% | +2.03% |
Volatility lens
| Measure | Value |
|---|---|
| Implied one-week move at the start of the week | 2.20% |
| Actual S&P 500 move, absolute | 0.08% |
| Actual as a multiple of implied | 0.04x |
| Realised volatility, annualised, 5 sessions | 11.1% |
| S&P 500 high to low range | 1.99% |
The week ahead
- Monday, September 21Chicago Fed National Activity Index for AugustA broad activity gauge that, if it weakens further, would add to the debate over how much more tightening the economy can absorb.
- Tuesday through Friday, September 22 to 25Federal Reserve officials speak publicly following the rate decisionWith the committee signaling more hikes could follow, any comments on the pace or conditions for a further move could move the front end of the curve.
- Thursday, September 24Weekly initial jobless claimsA labor market data point that, if it shows unexpected weakness, would complicate the case for additional hikes this year.
- Week of September 21Continued digestion of the September FOMC decision and dot plotWith most policymakers projecting at least one more hike in 2026, how yields and equities process that guidance without new data will shape positioning into October.
Common questions
Did the Federal Reserve raise interest rates this week?
Yes. The Federal Reserve raised its target range by 25 basis points to 3.75% to 4% on September 16, its first rate increase in three years, and a majority of policymakers signaled at least one more hike could follow this year.
Why did the S&P 500 barely move despite the Fed hike and a 10-year yield near 5%?
The index absorbed a decline on the Fed decision day and then recovered most of it the following session, leaving the S&P 500 down just 0.08% for the week even as the 10-year yield briefly traded above 5% and closed the week at 5.01%.
Why did the Dow underperform the Nasdaq this week?
The Dow fell 1.69% while the Nasdaq gained 0.72% because rate-sensitive sectors like Financials, down 2.39%, and Industrials, down 1.95%, carry more weight in the Dow, while large technology names that helped the Nasdaq were less exposed to the rate move.
Index, sector, commodity and currency figures are compiled from public closing prices. Treasury yields are from the U.S. Department of the Treasury daily par yield curve. The implied one-week move is the VIX close before the week began divided by the square root of 52, a common approximation. Commentary by Komey Tetteh.