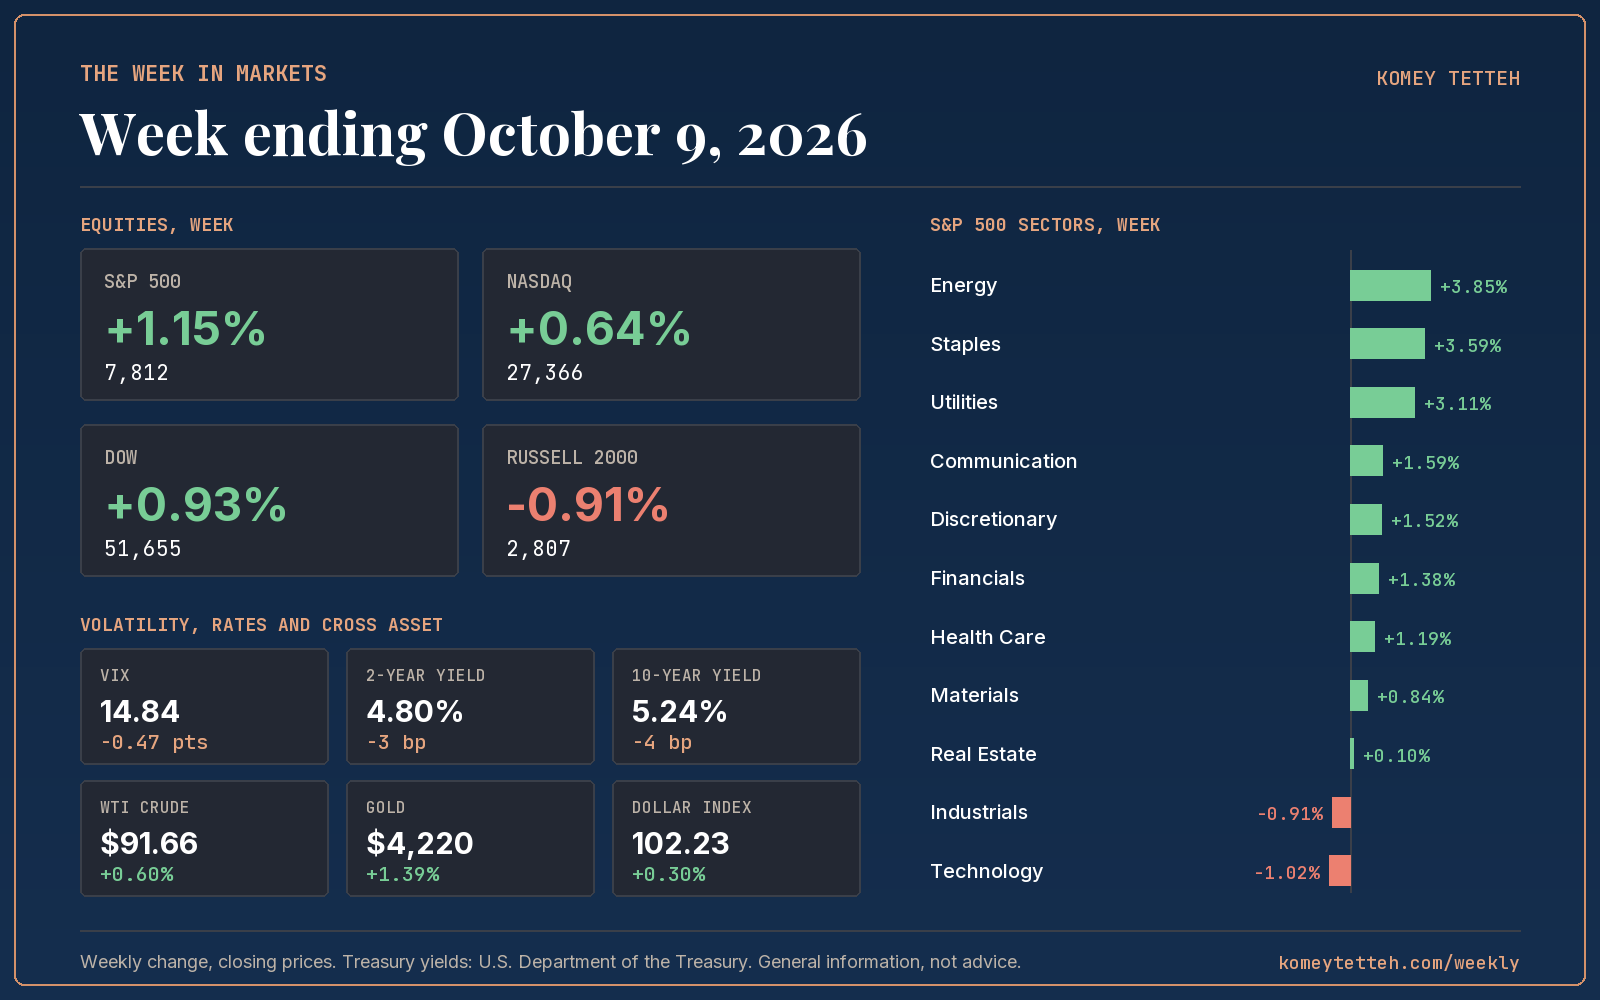
- The S&P 500 gained 1.15% to 7,812, a fresh high-side close; the Russell 2000 fell 0.91% to 2,807.
- Energy (+3.85%), Staples (+3.59%) and Utilities (+3.11%) led sectors; Technology (-1.02%) and Industrials (-0.91%) lagged.
- The 10-year yield eased 4 basis points to 5.24% even as Fed minutes signaled more hikes could be needed.
- The VIX fell to 14.84 from 15.31; gold rose 1.39% to $4,220 and the dollar index gained 0.30%.
- Options priced a 2.12% weekly move for the S&P 500; the index delivered 1.15%, about half of that.
What moved markets
Records built on a defensive base, not just tech
The S&P 500 closed at 7,812, up 1.15%, with several sessions printing fresh highs. Energy led at +3.85%, Staples added 3.59% and Utilities climbed 3.11%, while Technology was the week's weakest sector at -1.02% and Industrials fell 0.91%. A record run built on defensives and energy, not megacap growth, is a different animal than recent AI-led advances: breadth did the work.
Small caps told the opposite story. The Russell 2000 fell 0.91% even as large caps gained, pointing to continued sensitivity to long rates rather than to risk appetite broadly.
Yields eased, but the Fed's message did not soften
The 10-year yield fell 4 basis points to 5.24% and the 30-year eased 3 basis points to 5.60%, modest relief after a stretch of multi-decade highs. That relief came despite Federal Reserve minutes reaffirming that most policymakers see another hike as likely before year end. Absorbing a hawkish minutes release without a drawdown suggests either the hike is priced, or the long end's retreat matters more to equities than the committee's language.
Gold, oil and the dollar moved together
Gold rose 1.39% to $4,220, oil added 0.60% to $91.66, and the dollar index gained 0.30% to 102.23. These three usually diverge depending on which narrative dominates. Having them rise together alongside equity records suggests inflation hedging and dollar demand coexisted this week, consistent with pricing both resilient growth and a sticky inflation tail.
The volatility read
Volatility pricing told a cleaner story than the headlines. Heading into the week, the prior VIX close of 15.31 implied a one-week S&P 500 move of about 2.12%. The index delivered 1.15%, roughly 0.54 times what options had priced, with the full high-to-low range over five sessions landing at just 1.51%. Realised volatility annualised to 8.4%, far below what options were charging, even through a week with hawkish Fed minutes and a sharp rotation out of industrials and into energy.
The mechanism matters more than the number. When implied volatility sits well above realised volatility through a week with real macro crosscurrents, sellers of optionality get compensated for tail risk that did not show up at the index level, even though it did at the sector level. Industrials absorbed real damage mid-week on the rate move while the broad index barely wobbled: dispersion did the work that an index-level VIX spike normally would.
The VIX fell across the week, from 15.31 to 14.84, even as the 10-year finished at 5.24%, a level that would have demanded a far higher vol premium a year ago. Carry is cheap relative to a Fed that, by its own minutes, has not finished hiking. That describes how options are priced today, not what comes next.
The scorecard
Equities
| Index | Close | Week | Year to date |
|---|---|---|---|
| S&P 500 | 7,812 | +1.15% | +14.11% |
| Nasdaq Composite | 27,366 | +0.64% | +17.74% |
| Dow Jones Industrial Average | 51,655 | +0.93% | +7.47% |
| Russell 2000 | 2,807 | -0.91% | +13.10% |
Volatility, rates and cross asset
| Market | Close | Week |
|---|---|---|
| VIX | 14.84 | -0.47 pts |
| 2-year Treasury | 4.80% | -3 bp |
| 10-year Treasury | 5.24% | -4 bp |
| 30-year Treasury | 5.60% | -3 bp |
| WTI crude | $91.66 | +0.60% |
| Gold | $4,220 | +1.39% |
| US dollar index | 102.23 | +0.30% |
S&P 500 sectors
| Sector | Week | Year to date |
|---|---|---|
| Energy | +3.85% | +45.92% |
| Consumer Staples | +3.59% | +7.39% |
| Utilities | +3.11% | -3.79% |
| Communication Services | +1.59% | -4.80% |
| Consumer Discretionary | +1.52% | -6.45% |
| Financials | +1.38% | -0.99% |
| Health Care | +1.19% | +8.63% |
| Materials | +0.84% | +8.64% |
| Real Estate | +0.10% | +1.24% |
| Industrials | -0.91% | +8.56% |
| Technology | -1.02% | +37.38% |
Volatility lens
| Measure | Value |
|---|---|
| Implied one-week move at the start of the week | 2.12% |
| Actual S&P 500 move, absolute | 1.15% |
| Actual as a multiple of implied | 0.54x |
| Realised volatility, annualised, 5 sessions | 8.4% |
| S&P 500 high to low range | 1.51% |
The week ahead
- Monday, October 12Bond market holiday (Columbus Day)Treasury markets close while equities trade, which can thin liquidity and exaggerate moves in rate-sensitive sectors.
- Week of October 12Third-quarter earnings season opens, led by major banksBank results are a first check on whether the long end's retreat reflects easing credit stress; financials were already a stronger sector.
- Friday, October 16Monthly options expirationA large expiration can remove dealer hedging flows that have helped pin the index near current levels, given how compressed implied volatility already is.
Common questions
Why did the S&P 500 hit new highs this week while small caps fell?
The S&P 500 gained 1.15% to 7,812 on gains in energy, staples and utilities, while the Russell 2000 fell 0.91% to 2,807. Small caps carry more floating-rate debt and are more sensitive to long-term yields, which stayed near 5.24% on the 10-year.
What did Fed minutes say about future rate hikes?
Minutes from the Federal Reserve's recent meeting indicated most policymakers see another hike as more likely than not before year end. Markets largely absorbed that message, with the S&P 500 closing the week higher regardless.
What does it mean that implied volatility was higher than actual volatility this week?
Options priced a 2.12% weekly move for the S&P 500, but the index moved only 1.15%, with realised volatility annualising to 8.4%. That gap means options buyers paid for protection against turbulence that showed up in sectors like industrials, not at the index level.
Index, sector, commodity and currency figures are compiled from public closing prices. Treasury yields are from the U.S. Department of the Treasury daily par yield curve. The implied one-week move is the VIX close before the week began divided by the square root of 52, a common approximation. Commentary by Komey Tetteh.