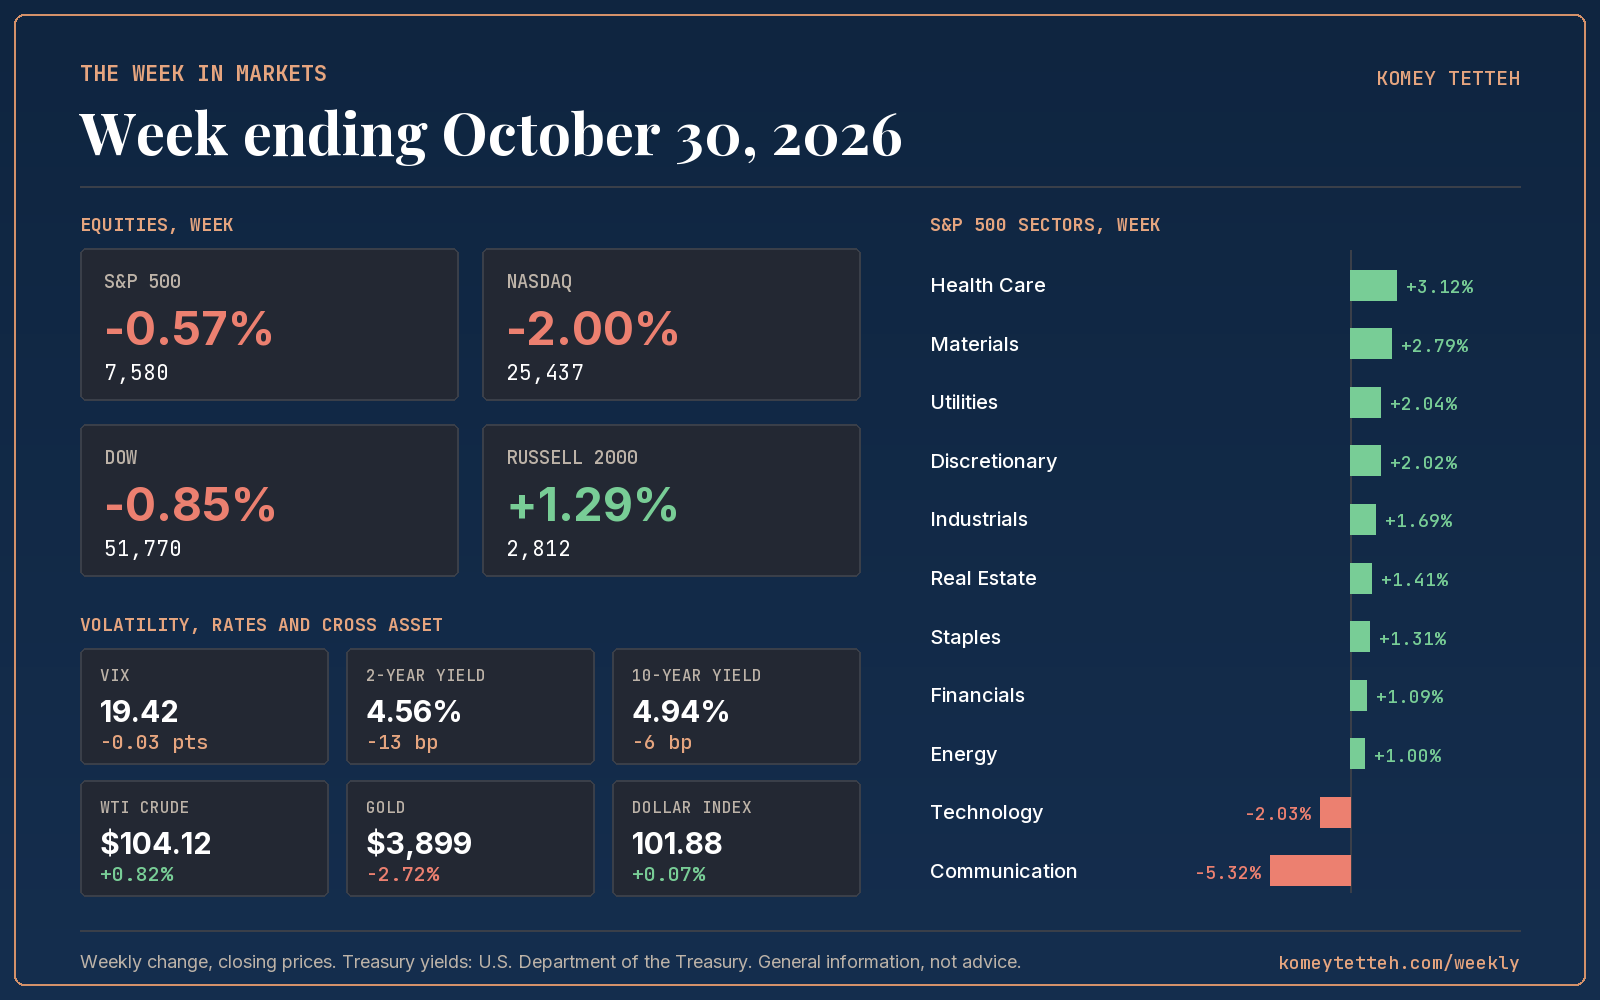
- The S&P 500 fell 0.57% for the week to 7,580, masking a Friday session that erased most of the prior gains.
- The Nasdaq Composite dropped 2.00% while the Russell 2000 rose 1.29%, one of the sharpest large cap to small cap splits of the year.
- The Federal Reserve held its benchmark rate at 3.75% to 4% in a split vote, with December hike odds moving up afterward.
- Treasury yields fell across the curve, the 2 year down 13 basis points to 4.56% and the 10 year down 6 basis points to 4.94%.
What moved markets
Alphabet's Miss Drags Communication Services
Communication Services was the week's worst sector, down 4.08%, on an Alphabet revenue miss that reignited scrutiny of AI infrastructure spending. Amazon's cautious fourth quarter guidance and a drop in Intel shares compounded the concern into Friday, when the S&P 500 fell 1.82%. Technology itself still finished higher, up 3.01%, after chipmakers rallied earlier in the week. That split points to a concentrated repricing of AI capital spending risk, not a broad verdict on the sector.
Small Caps and Industrials Shrug Off the Tech Scare
The Russell 2000 gained 1.29% for the week even as the Nasdaq Composite fell 2.00%. Industrials led all sectors at 3.35%, with Health Care, Consumer Discretionary and Financials all up more than 1.8%. Only Communication Services, Energy and Consumer Staples finished lower. A market where most sectors advance while one mega-cap name drags the headline index down is reallocating, not retreating.
The Fed Holds, Futures Don't Relax
The Federal Reserve held its benchmark rate at 3.75% to 4% on October 28 in a split vote. There were two dissenters from the FOMC decision to leave interest rates unchanged: Cleveland Fed President Beth Hammack and Fed Governor Lisa Cook each voted in favor of hiking interest rates by 25 basis points. Chair Kevin Warsh declined to commit to a path forward and pushed back on any suggestion that the coming midterm elections had a role in the decision. Futures disagreed with a dovish read: the probability of a 25 basis point hike in December rose to 82.6%, up from 78.3% a day ago, according to the CME FedWatch tool.
Yields Fall Despite Firmer Inflation Signals
Treasury yields fell despite that firmer inflation backdrop, with the 2 year down 13 basis points to 4.56% and the 10 year down 6 basis points to 4.94%. That combination points to an equity led bid for duration on Friday's selloff rather than inflation driving yields higher. Gold fell 3.07% to $3,885, a reminder that a retreat from risk assets does not mean a flight into every hedge at once.
The volatility read
Options priced a one week move of 2.70% for the S&P 500, derived from the prior week's VIX divided by the square root of 52. The index delivered an absolute move of 0.57%, about a fifth of that. On the surface, a quiet week.
It was not. Realised volatility annualised to 16.5%, modest in isolation, but the index traveled a high to low range of 3.07% along the way, more than the entire implied move packed into one round trip. The VIX closed almost exactly where it started, 19.42 versus 19.45. A flat VIX against a 3.07% intraweek range is the signature of dispersion, not direction: Alphabet cracked, industrials and small caps firmed, and the index-level gauge barely noticed because the moves offset.
The scorecard
Equities
| Index | Close | Week | Year to date |
|---|---|---|---|
| S&P 500 | 7,580 | -0.57% | +10.73% |
| Nasdaq Composite | 25,437 | -2.00% | +9.44% |
| Dow Jones Industrial Average | 51,770 | -0.85% | +7.71% |
| Russell 2000 | 2,812 | +1.29% | +13.29% |
Volatility, rates and cross asset
| Market | Close | Week |
|---|---|---|
| VIX | 19.42 | -0.03 pts |
| 2-year Treasury | 4.56% | -13 bp |
| 10-year Treasury | 4.94% | -6 bp |
| 30-year Treasury | 5.31% | -2 bp |
| WTI crude | $104.12 | +0.82% |
| Gold | $3,899 | -2.72% |
| US dollar index | 101.88 | +0.07% |
S&P 500 sectors
| Sector | Week | Year to date |
|---|---|---|
| Health Care | +3.12% | +19.43% |
| Materials | +2.79% | +16.30% |
| Utilities | +2.04% | +1.73% |
| Consumer Discretionary | +2.02% | -3.37% |
| Industrials | +1.69% | +7.92% |
| Real Estate | +1.41% | +6.99% |
| Consumer Staples | +1.31% | +15.11% |
| Financials | +1.09% | +3.18% |
| Energy | +1.00% | +56.61% |
| Technology | -2.03% | +24.69% |
| Communication Services | -5.32% | -15.14% |
Volatility lens
| Measure | Value |
|---|---|
| Implied one-week move at the start of the week | 2.70% |
| Actual S&P 500 move, absolute | 0.57% |
| Actual as a multiple of implied | 0.21x |
| Realised volatility, annualised, 5 sessions | 16.5% |
| S&P 500 high to low range | 3.07% |
The week ahead
- Monday, November 2ISM Manufacturing PMI and Palantir earningsa factory reading stuck in contraction alongside a high-multiple AI earnings report would extend the capex scrutiny that drove Friday's selloff.
- Tuesday, November 3AMD earningsa chip report lands directly into the same AI infrastructure debate behind Friday's move.
- Wednesday, November 4ISM Services PMIservices make up most of the economy, so this is the broader signal on whether growth is holding up.
- Friday, November 6Employment reportif job growth and wages run hot alongside recent inflation data, that builds the case markets are already pricing for a December hike.
Common questions
Why did the S&P 500 fall this week despite most sectors rising?
A small number of mega-cap technology and communication services names, led by Alphabet, fell sharply enough to drag the index lower even as most sectors finished higher.
Did the Federal Reserve raise interest rates this week?
No. The Fed held its benchmark rate at 3.75% to 4% on October 28 in a split vote, and futures pricing for a December increase rose afterward.
What does the gap between implied and realised volatility show?
Options priced a 2.70% weekly move for the S&P 500 but it moved only 0.57%, even with a 3.07% high to low range along the way; the risk was concentrated in sectors, not spread across the index.
Index, sector, commodity and currency figures are compiled from public closing prices. Treasury yields are from the U.S. Department of the Treasury daily par yield curve. The implied one-week move is the VIX close before the week began divided by the square root of 52, a common approximation. Commentary by Komey Tetteh.