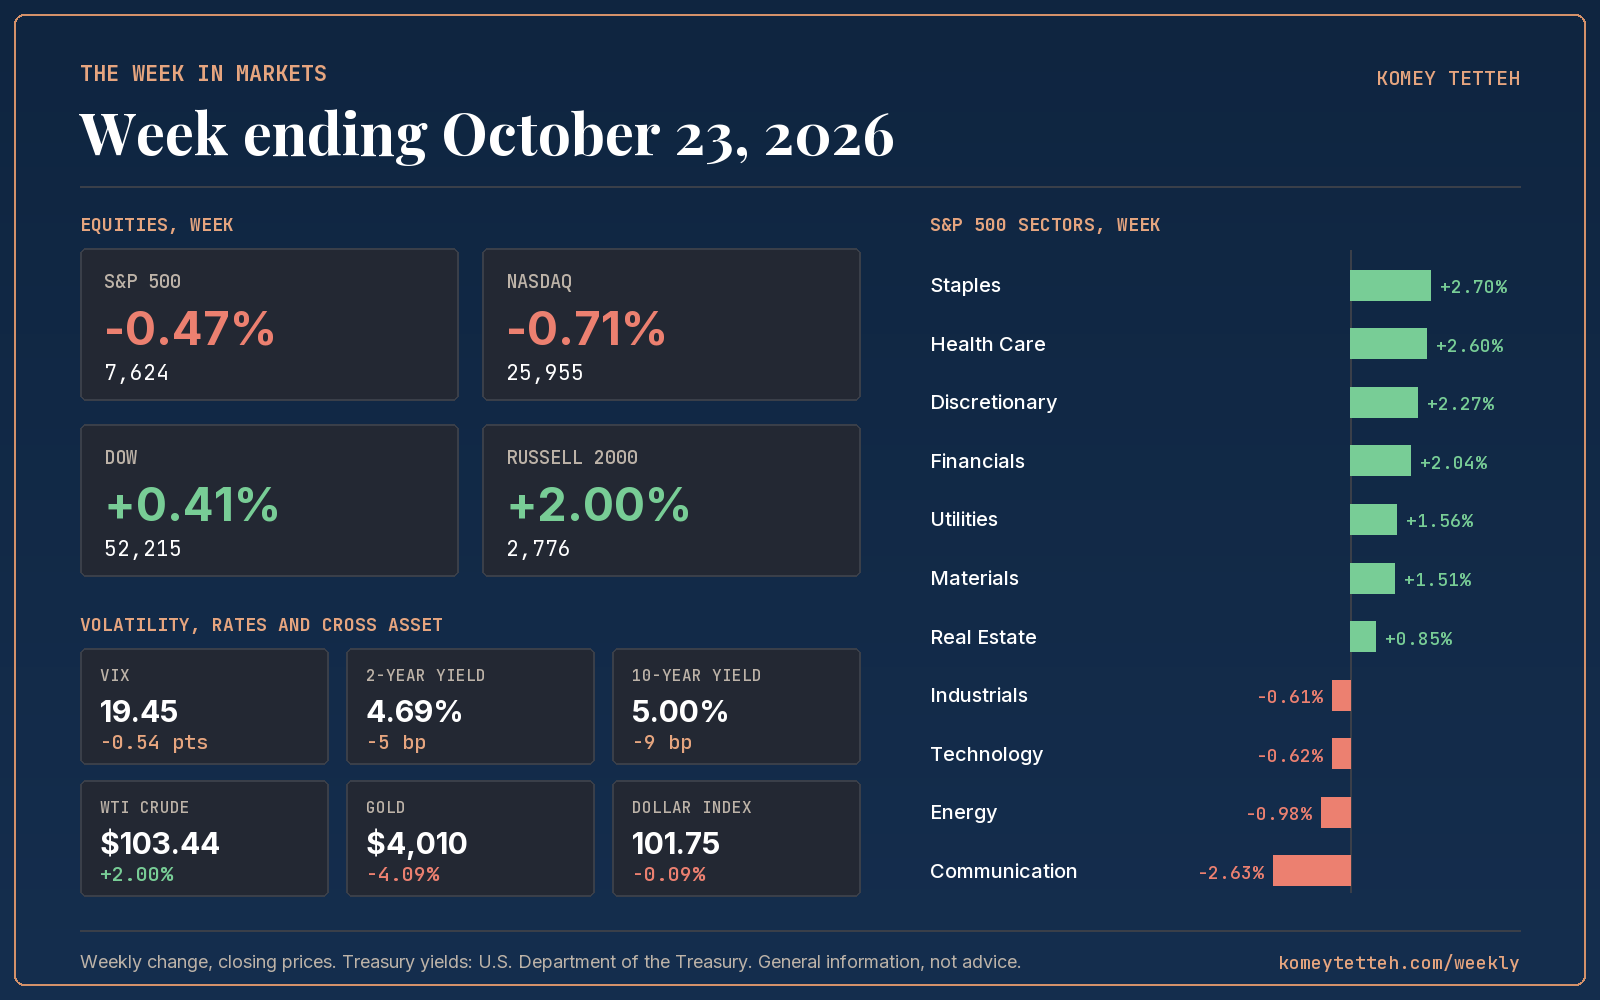
- The S&P 500 fell 0.47% to 7,624, with a 2.08% high to low range dwarfing the net weekly move.
- The Russell 2000 gained 2.00% and the Dow added 0.41%, while the Nasdaq fell 0.71% as AI stocks reversed midweek.
- Consumer Staples (+2.70%) and Health Care (+2.60%) led a defensive rotation; Communication Services fell 2.63%.
- WTI crude rose 2.00% to $103.44, gold fell 4.09% to $4,010, and the 10-year yield dropped 9 basis points to 5.00%.
- The VIX eased from 19.99 to 19.45 across the week but swung from near 16.73 to above 19.85 intraweek.
What moved markets
The AI trade round-tripped in five sessions
Technology opened the week on a rebound in chip and data center names, then reversed hard after capex and financing commentary around mega-cap earnings hit infrastructure suppliers alongside semiconductors. The sector closed down just 0.62%, hiding a sharp intraweek swing.
Communication Services took the heaviest damage, down 2.63%, on a cloud capacity warning and a selloff in China-listed technology names. Software held up better than infrastructure, a market pricing financing risk differently within one AI theme.
Small caps and value sectors did the real work
While the headline index slipped, the Russell 2000 added 2.00% and four of the week's five best sectors were defensive or value oriented: Staples, Health Care, Financials and Utilities. The Dow gained 0.41% even as the Nasdaq fell 0.71%. That divergence is the week's clearest signal: capital rotated out of concentrated AI exposure without a broad risk-off move in credit or volatility.
Oil's jump complicated the rate picture into the Fed
WTI rose 2.00% to $103.44 on Middle East tension, feeding the debate over whether the Fed holds or hikes on October 28. Energy was the only sector higher on Friday, while oil-sensitive travel names led decliners. Gold fell 4.09% to $4,010, more consistent with dollar strength than a safe-haven bid.
Yields moved the other way: the 10-year fell 9 basis points to 5.00% even as hot producer price data kept hike chatter alive. Oil up and yields down together does not confirm one narrative; it reflects a market undecided whether this is an inflation shock or a growth signal.
The volatility read
Options priced a one-week move of 2.77% for the S&P 500, derived from the prior week's VIX close of 19.99. The index delivered an absolute move of 0.47%, about a fifth of what was implied. Realised volatility over the five sessions annualised to 12.0%, well below the roughly 19% the VIX level implies on its own. By that measure, the week looks calm.
The 2.08% high to low range says otherwise. The index touched both ends of a band four times wider than its net change, with a tech-led rally through midweek fully reversing by Friday. The VIX round-tripped from 19.99 to near 16.73 before jumping above 19.85, then settling at 19.45. That volatility showed up as dispersion and reversal, not a sustained trend.
This is a market pricing event risk rather than a view. With the Fed decision and mega-cap earnings landing the following week, options held a premium for binary outcomes while the index ground within a range. Carrying protection through a week like this looked expensive against the close-to-close tape, but the intraweek swings show why it was not wasted.
The scorecard
Equities
| Index | Close | Week | Year to date |
|---|---|---|---|
| S&P 500 | 7,624 | -0.47% | +11.37% |
| Nasdaq Composite | 25,955 | -0.71% | +11.67% |
| Dow Jones Industrial Average | 52,215 | +0.41% | +8.64% |
| Russell 2000 | 2,776 | +2.00% | +11.85% |
Volatility, rates and cross asset
| Market | Close | Week |
|---|---|---|
| VIX | 19.45 | -0.54 pts |
| 2-year Treasury | 4.69% | -5 bp |
| 10-year Treasury | 5.00% | -9 bp |
| 30-year Treasury | 5.33% | -10 bp |
| WTI crude | $103.44 | +2.00% |
| Gold | $4,010 | -4.09% |
| US dollar index | 101.75 | -0.09% |
S&P 500 sectors
| Sector | Week | Year to date |
|---|---|---|
| Consumer Staples | +2.70% | +15.85% |
| Health Care | +2.60% | +17.12% |
| Consumer Discretionary | +2.27% | -3.68% |
| Financials | +2.04% | +3.43% |
| Utilities | +1.56% | +0.42% |
| Materials | +1.51% | +13.98% |
| Real Estate | +0.85% | +5.38% |
| Industrials | -0.61% | +7.48% |
| Technology | -0.62% | +26.65% |
| Energy | -0.98% | +51.13% |
| Communication Services | -2.63% | -8.75% |
Volatility lens
| Measure | Value |
|---|---|
| Implied one-week move at the start of the week | 2.77% |
| Actual S&P 500 move, absolute | 0.47% |
| Actual as a multiple of implied | 0.17x |
| Realised volatility, annualised, 5 sessions | 12.0% |
| S&P 500 high to low range | 2.08% |
The week ahead
- Wednesday, October 28FOMC rate decisionA hold leaves room for the front end to reprice lower; a hike on hot inflation data could pull short and long yields apart.
- Wednesday, October 28Microsoft earningsCloud and AI spending commentary could extend or reverse this week's dispersion in infrastructure and chip names.
- Thursday, October 29Amazon and Apple earningsGuidance here would test whether this week's AI reversal was a pause or a repricing.
- Friday, October 30Month end rebalancing flowsFlows tied to month end can exaggerate moves independent of news.
Common questions
Why did the S&P 500 fall this week despite small caps rallying?
The index was dragged down by a reversal in AI-linked technology and communication services stocks, the latter down 2.63%, while defensives like Consumer Staples and Health Care gained over 2.5% each. The Russell 2000's 2.00% gain reflects rotation into smaller, less AI-concentrated names.
What does the gap between implied and realised volatility mean?
Options priced a 2.77% weekly move, but the index only moved 0.47%, with realised volatility annualising to 12.0%. That gap, with a 2.08% high to low range, suggests risk was absorbed through rotation and intraweek reversal rather than a sustained move.
Why did oil rise and gold fall in the same week?
WTI gained 2.00% to $103.44 on Middle East tension, while gold dropped 4.09% to $4,010, more typical of dollar strength than a safe-haven flow. The divergence points to a market weighing an inflation risk against the Fed's October 28 decision.
Index, sector, commodity and currency figures are compiled from public closing prices. Treasury yields are from the U.S. Department of the Treasury daily par yield curve. The implied one-week move is the VIX close before the week began divided by the square root of 52, a common approximation. Commentary by Komey Tetteh.