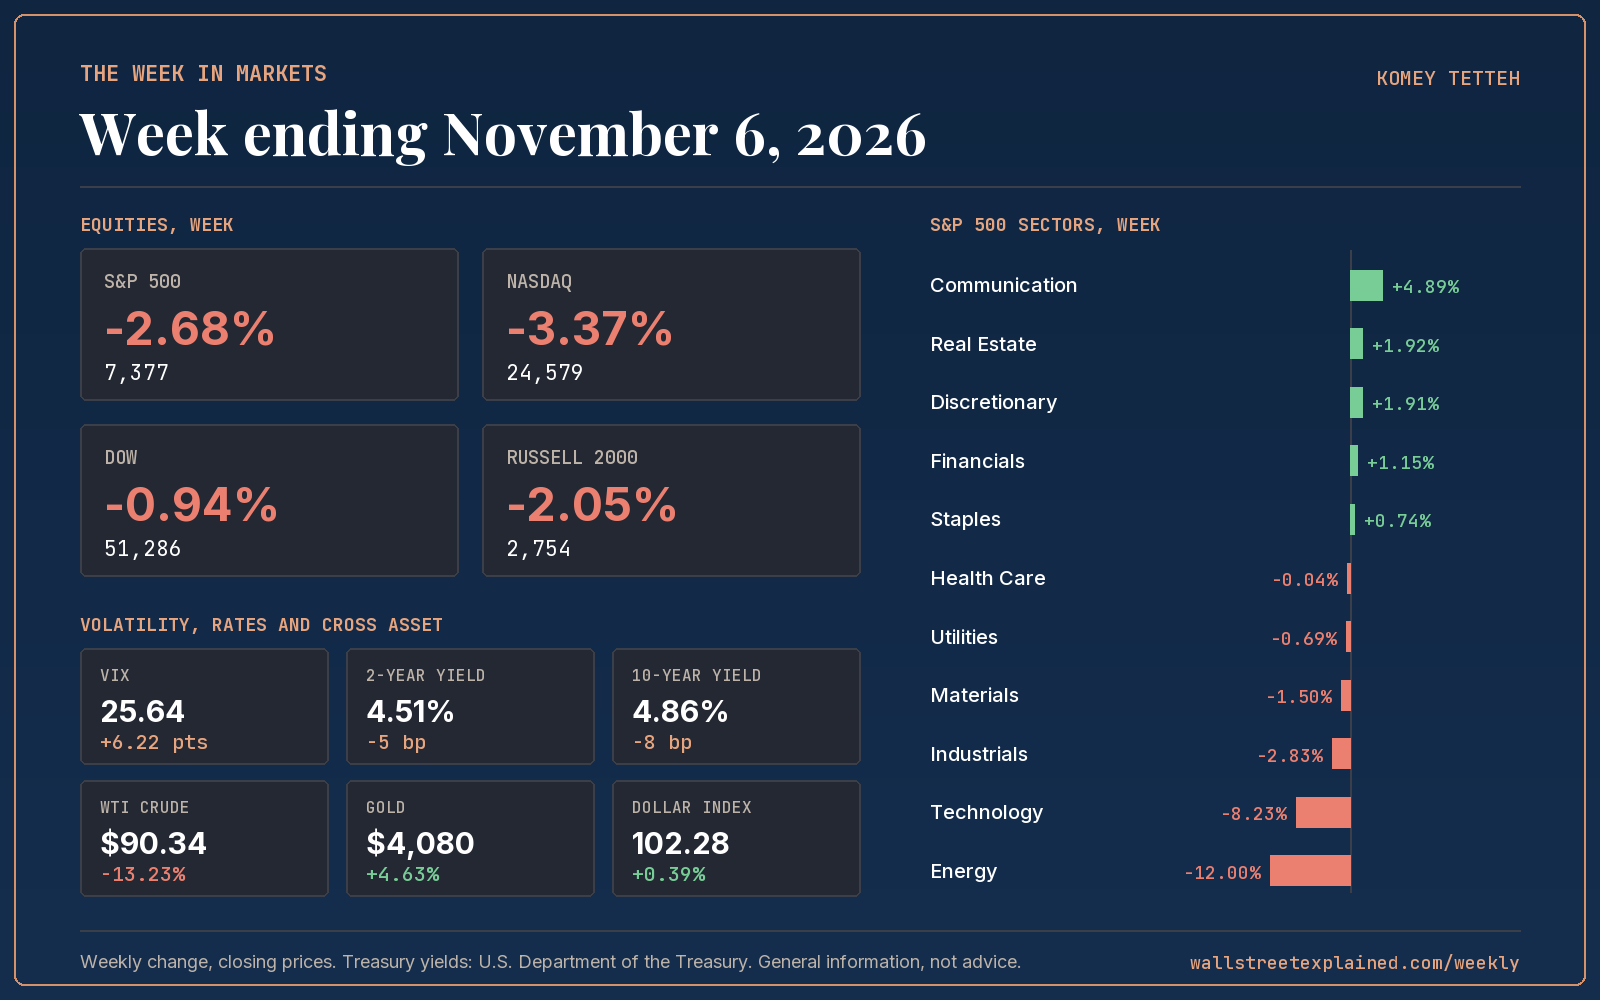
- The S&P 500 fell 2.68% to 7,377, leaving the index up 7.76% year to date.
- The Nasdaq Composite dropped 3.37% as Technology lost 8.23%, the week's worst sector by a wide margin.
- The VIX jumped from 19.42 to 25.64, a 32% move that reset the volatility backdrop for the first time in months.
- Treasury yields eased across the curve, with the 10-year down 8 basis points to 4.86% even as Fed officials leaned hawkish.
- Gold rose 4.63% to $4,080 while WTI crude fell 13.23% to $90.34, a split that reflects safety demand colliding with oversupply fears.
What moved markets
The AI trade cracked, and tech took the index with it
Technology stocks fell 8.23% for the week, the single largest sector move and the one that explains most of the index decline. The damage concentrated in AI infrastructure names: hardware makers, memory suppliers and software platforms that had carried the market for much of the year gave back ground in a matter of sessions. The proximate trigger was a sharpening debate over AI capital spending, layered on top of lingering unease about how that spending gets financed.
The pattern mattered as much as the size of the move. A broad relief rally following the midterm elections gave way within 24 hours to a concentrated unwind in the same complex that had been rallying. That sequence, a sharp up day followed immediately by a sharp down day in the same names, is a signature of positioning unwinding rather than a change in the underlying earnings outlook. Energy fell even harder, down 12% on the week as crude dropped 13.23%, but that move traces to supply dynamics rather than the AI story.
The Fed stayed hawkish even as the data gave it room not to
October payrolls data, strong enough to keep the labor market read firm, combined with hawkish commentary from several regional Fed presidents to push the market further toward pricing a December rate decision as live rather than settled. That combination, resilient jobs data plus persistent hawkish rhetoric, is unusual timing just after a Fed meeting that itself delivered no hawkish surprise. The result was a curve that eased in yield terms across every maturity even as the rate conversation got more charged, a sign that the move in yields this week was more about risk aversion pulling money into duration than about a dovish shift in rate expectations.
Communication Services and Real Estate held the line
Not every part of the market traded the AI unwind. Communication Services gained 4.89% and Real Estate rose 1.92%, both benefiting from the same falling yields that pressured the rate-sensitive AI capex names. Financials and Consumer Discretionary also finished positive, aided by a midterm relief bounce earlier in the week. That dispersion, a 4.89% gain in one sector alongside an 8.23% loss in another, is the clearest evidence that this was a sector rotation inside a volatile week rather than a uniform risk-off event.
The volatility read
Options going into the week priced a one-week move of 2.69% for the S&P 500, derived from the prior week's VIX close. The index delivered an absolute move of 2.68%, almost exactly what was priced. On the surface, that looks like a quiet week for volatility sellers. It was not.
The headline number hides the path. Realised volatility over the week's five sessions ran at an annualised 36.6%, and the high to low range across the week reached 4.97%, nearly double the net weekly change. That is the signature of a week that round-tripped hard: a relief rally on the midterm outcome, then a sharp reversal as the AI trade cracked, with the index arriving close to where the options market expected only because the moves inside the week offset each other. A trader who sold the implied 2.69% move and collected premium on Monday was still short volatility through a day where the index alone moved more than 4%.
The VIX closing the week at 25.64, up from 19.42, confirms that the options market repriced risk after the fact rather than ahead of it. That sequencing, realised volatility running hot before implied catches up, is typical of a shock that was not fully anticipated. It leaves next week's options priced for a more turbulent environment than the one that existed a week ago, regardless of whether the AI capex debate resolves calmly or not.
The scorecard
Equities
| Index | Close | Week | Year to date |
|---|---|---|---|
| S&P 500 | 7,377 | -2.68% | +7.76% |
| Nasdaq Composite | 24,579 | -3.37% | +5.75% |
| Dow Jones Industrial Average | 51,286 | -0.94% | +6.70% |
| Russell 2000 | 2,754 | -2.05% | +10.97% |
Volatility, rates and cross asset
| Market | Close | Week |
|---|---|---|
| VIX | 25.64 | +6.22 pts |
| 2-year Treasury | 4.51% | -5 bp |
| 10-year Treasury | 4.86% | -8 bp |
| 30-year Treasury | 5.26% | -5 bp |
| WTI crude | $90.34 | -13.23% |
| Gold | $4,080 | +4.63% |
| US dollar index | 102.28 | +0.39% |
S&P 500 sectors
| Sector | Week | Year to date |
|---|---|---|
| Communication Services | +4.89% | -10.98% |
| Real Estate | +1.92% | +9.05% |
| Consumer Discretionary | +1.91% | -1.53% |
| Financials | +1.15% | +4.36% |
| Consumer Staples | +0.74% | +15.96% |
| Health Care | -0.04% | +19.38% |
| Utilities | -0.69% | +1.03% |
| Materials | -1.50% | +14.55% |
| Industrials | -2.83% | +4.87% |
| Technology | -8.23% | +14.43% |
| Energy | -12.00% | +37.82% |
Volatility lens
| Measure | Value |
|---|---|
| Implied one-week move at the start of the week | 2.69% |
| Actual S&P 500 move, absolute | 2.68% |
| Actual as a multiple of implied | 1.00x |
| Realised volatility, annualised, 5 sessions | 36.6% |
| S&P 500 high to low range | 4.97% |
The week ahead
- Tuesday, Nov 10October Consumer Price IndexIf inflation runs hotter than the prior 3.7% annual pace, the pressure point is the front end of the curve, given how close the market now sits to a live December rate decision.
- Throughout the weekFederal Reserve regional president commentaryWith several officials having leaned hawkish in the days after payrolls, further remarks could sway how much of a December move gets priced into front-end yields.
- Throughout the weekAI-complex earnings reportsAfter a week where capex concerns drove an 8% sector decline, company-level guidance on spending plans is the data point most likely to confirm or ease that concern.
Common questions
Why did the stock market fall this week?
The S&P 500 fell 2.68% as Technology stocks dropped 8.23% on renewed concerns about AI capital spending, following a brief post-midterm relief rally that quickly reversed. A hawkish tone from several Federal Reserve officials after a strong October jobs report added to the pressure.
What happened to volatility this week?
The VIX rose from 19.42 to 25.64, a jump of roughly 32%, after realised volatility in the S&P 500 ran well above what options had priced for most of the week. The index's high to low range reached 4.97%, nearly double its net weekly change, reflecting a sharp round trip rather than a steady decline.
Why did Treasury yields fall even though the Fed sounded hawkish?
The 10-year yield eased 8 basis points to 4.86% as investors moved into government debt during the equity selloff, a flight to safety that can push yields down even when rate-cut expectations are not increasing. Strong October payrolls data pushed the market to price a December Fed decision as more contested, which kept hawkish rhetoric alive alongside falling yields.
Index, sector, commodity and currency figures are compiled from public closing prices. Treasury yields are from the U.S. Department of the Treasury daily par yield curve. The implied one-week move is the VIX close before the week began divided by the square root of 52, a common approximation. Commentary by Komey Tetteh.