- The S&P 500 closed at 7,723, down 0.27% on the week, while the Nasdaq Composite gained 0.45% to 27,191.
- The 10-year Treasury yield rose 11 basis points to 5.28% even as September payrolls came in at just 29,000 and unemployment rose to 4.2%.
- The VIX ended the week at 15.31, up from 14.87, after a Friday relief rally pulled it down 6.2% on the day.
- Energy led sectors at +1.06% while Communication Services lagged at -2.67%, and gold fell 3.45% to $4,172.
- The S&P 500 moved just 0.27% on the week against an implied move of 2.06%, a realized-to-implied ratio of 0.13x.
What moved markets
Payrolls Deliver the Week's Real Surprise
September nonfarm payrolls rose 29,000, far short of the roughly 84,000 to 90,000 economists expected, and the unemployment rate rose to 4.2% from 4.1%. The report followed a Federal Reserve rate hike delivered on September 16, and it effectively undercut the data that justified it: July and August payrolls were revised down by a combined 60,000. Interest rate futures moved quickly, pricing a sharply reduced chance of a hike at the Fed's late October meeting, down from odds above 60% a week earlier.
Equities read the weak print as relief rather than warning. The S&P 500 rose 0.74% on the Friday session and the VIX fell 6.2% to 15.31, even though it still finished the week higher than where it started. The gap between a softening labor market and a market treating that softness as good news for stocks is the week's central tension: good news for rate policy, less clear news for growth.
The Long End Never Got the Memo
Even as hike odds fell, the 10-year yield rose through the week, adding 11 basis points to close at 5.28%, and the 30-year added 14 basis points to 5.63%. Desk-level moves earlier in the week showed yields pushing toward multi-decade highs on a mix of inflation prints, rate-hike repricing and renewed Middle East oil tension, before easing intraday without ever giving back the week's net gain. That persistence in the long end, even against a softening jobs report, is the detail equity investors should not skip past: duration-sensitive sectors took the hit regardless of what the payrolls number implied for short rates.
Semiconductors Carried the Index
Nvidia reached a $5.7 trillion market capitalization on the week's final session, with AMD and Arm posting strong single-day gains alongside it. Technology rose 0.78% on the week and was the only major sector apart from Energy and Utilities to finish positive, which explains why the Nasdaq Composite gained 0.45% while the Dow Jones Industrial Average fell 1.26%. The divergence is a market concentrating its enthusiasm in a narrow group of AI-linked names while broader cyclicals and defensives, from Financials (-2.52%) to Health Care (-2.64%), absorbed the week's rate pressure.
Commodities and the Dollar Told a Different Story
Gold fell 3.45% to $4,172 and WTI crude slipped 1.24% to $91.26, while the dollar index rose 0.94% to 101.92. A stronger dollar alongside falling gold is the classic signature of reduced safe-haven demand, consistent with a week where equity volatility compressed into the Friday close even as the rates story stayed unresolved.
The volatility read
Options went into the week pricing a one-week move of 2.06% for the S&P 500, derived from the prior week's VIX close of 14.87. The index delivered an absolute move of just 0.27%, a realized-to-implied ratio of 0.13x. Realized volatility over the five sessions annualized to 8.9%, against an implied level closer to three times that. The market paid for turbulence it did not get.
That gap matters more than the headline close. A soft payrolls report, a rate hike delivered three weeks earlier on data since revised away, a 10-year yield still pushing toward multi-decade highs, and a semiconductor sector hitting fresh records are not inputs that typically net out to a quiet tape. Yet the week's high-to-low range was only 1.81%, and the index absorbed each shock without a directional break. Implied volatility held a premium to realized all week, including a VIX print that rose on down days and fell faster than the index gained on Friday's rally. That is a market structure pricing event risk around the Fed and the long end, not one expressing conviction either way.
The honest read is that implied volatility was arguably the more useful signal than the index close. A 0.13x realized-to-implied ratio in a week with a weak jobs report, a hawkish-leaning Fed overhang and yields at multi-decade highs says positioning, not complacency: options markets kept a premium bid precisely because the next data point, not this week's, is where the real repricing risk sits.
The scorecard
Equities
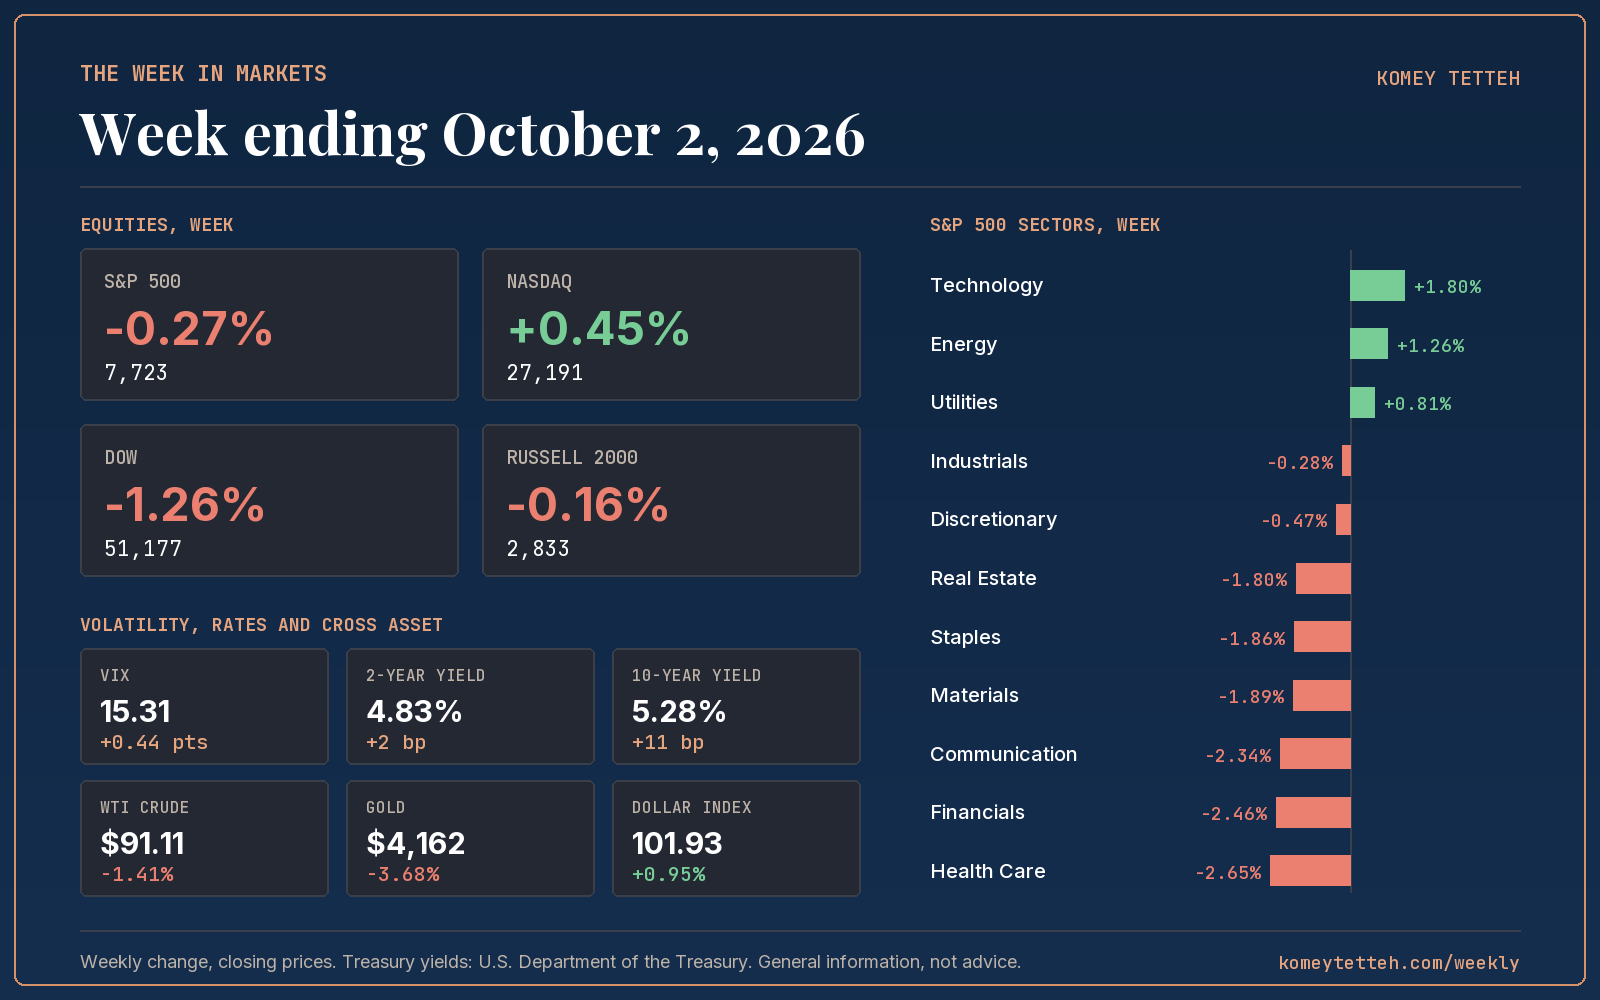
| Index | Close | Week | Year to date |
|---|---|---|---|
| S&P 500 | 7,723 | -0.27% | +12.81% |
| Nasdaq Composite | 27,191 | +0.45% | +16.99% |
| Dow Jones Industrial Average | 51,177 | -1.26% | +6.48% |
| Russell 2000 | 2,833 | -0.16% | +14.14% |
Volatility, rates and cross asset
| Market | Close | Week |
|---|---|---|
| VIX | 15.31 | +0.44 pts |
| 2-year Treasury | 4.83% | +2 bp |
| 10-year Treasury | 5.28% | +11 bp |
| 30-year Treasury | 5.63% | +14 bp |
| WTI crude | $91.11 | -1.41% |
| Gold | $4,162 | -3.68% |
| US dollar index | 101.93 | +0.95% |
S&P 500 sectors
| Sector | Week | Year to date |
|---|---|---|
| Technology | +1.80% | +38.79% |
| Energy | +1.26% | +40.51% |
| Utilities | +0.81% | -6.70% |
| Industrials | -0.28% | +9.56% |
| Consumer Discretionary | -0.47% | -7.85% |
| Real Estate | -1.80% | +1.14% |
| Consumer Staples | -1.86% | +3.67% |
| Materials | -1.89% | +7.74% |
| Communication Services | -2.34% | -6.29% |
| Financials | -2.46% | -2.34% |
| Health Care | -2.65% | +7.35% |
Volatility lens
| Measure | Value |
|---|---|
| Implied one-week move at the start of the week | 2.06% |
| Actual S&P 500 move, absolute | 0.27% |
| Actual as a multiple of implied | 0.13x |
| Realised volatility, annualised, 5 sessions | 8.9% |
| S&P 500 high to low range | 1.81% |
The week ahead
- Monday, Oct 5ISM Services PMIif services activity cools alongside the weak jobs report, the case for the Fed to skip its October hike gets reinforced; a hot reading would reopen the debate.
- Thursday, Oct 8Weekly initial jobless claimsclaims are the most current labor market read available, and another soft print would extend the narrative set by Friday's payrolls number.
- Through the weekFed officials' public remarkswith October hike odds reset lower, any commentary from policymakers on the labor data could move the front end of the yield curve quickly.
- Through the weekLong-end Treasury auctions and yield actionthe 10-year and 30-year yields rose all week despite the weak jobs print, and a further push higher is the clearest channel for equity volatility to reassert itself.
Common questions
Why did the S&P 500 fall this week even though the jobs report was weak?
The S&P 500 closed at 7,723, down 0.27% on the week, as earlier sessions were pressured by rising Treasury yields and rate-hike repricing before a weak September payrolls report on Friday, which showed just 29,000 jobs added and unemployment at 4.2%, sparked a relief rally into the close.
What did the September jobs report show?
Nonfarm payrolls rose 29,000 in September, well below the roughly 84,000 to 90,000 economists expected, and the unemployment rate rose to 4.2% from 4.1%. The Bureau of Labor Statistics also revised July and August payrolls down by a combined 60,000 jobs.
Why did the 10-year Treasury yield rise even after the soft jobs report?
The 10-year yield added 11 basis points on the week to close at 5.28%, reflecting a week of inflation and rate-hike repricing that outweighed Friday's single weak data point; yields remained near multi-decade highs despite reduced odds of an October Fed hike.
Index, sector, commodity and currency figures are compiled from public closing prices. Treasury yields are from the U.S. Department of the Treasury daily par yield curve. The implied one-week move is the VIX close before the week began divided by the square root of 52, a common approximation. Commentary by Komey Tetteh.