
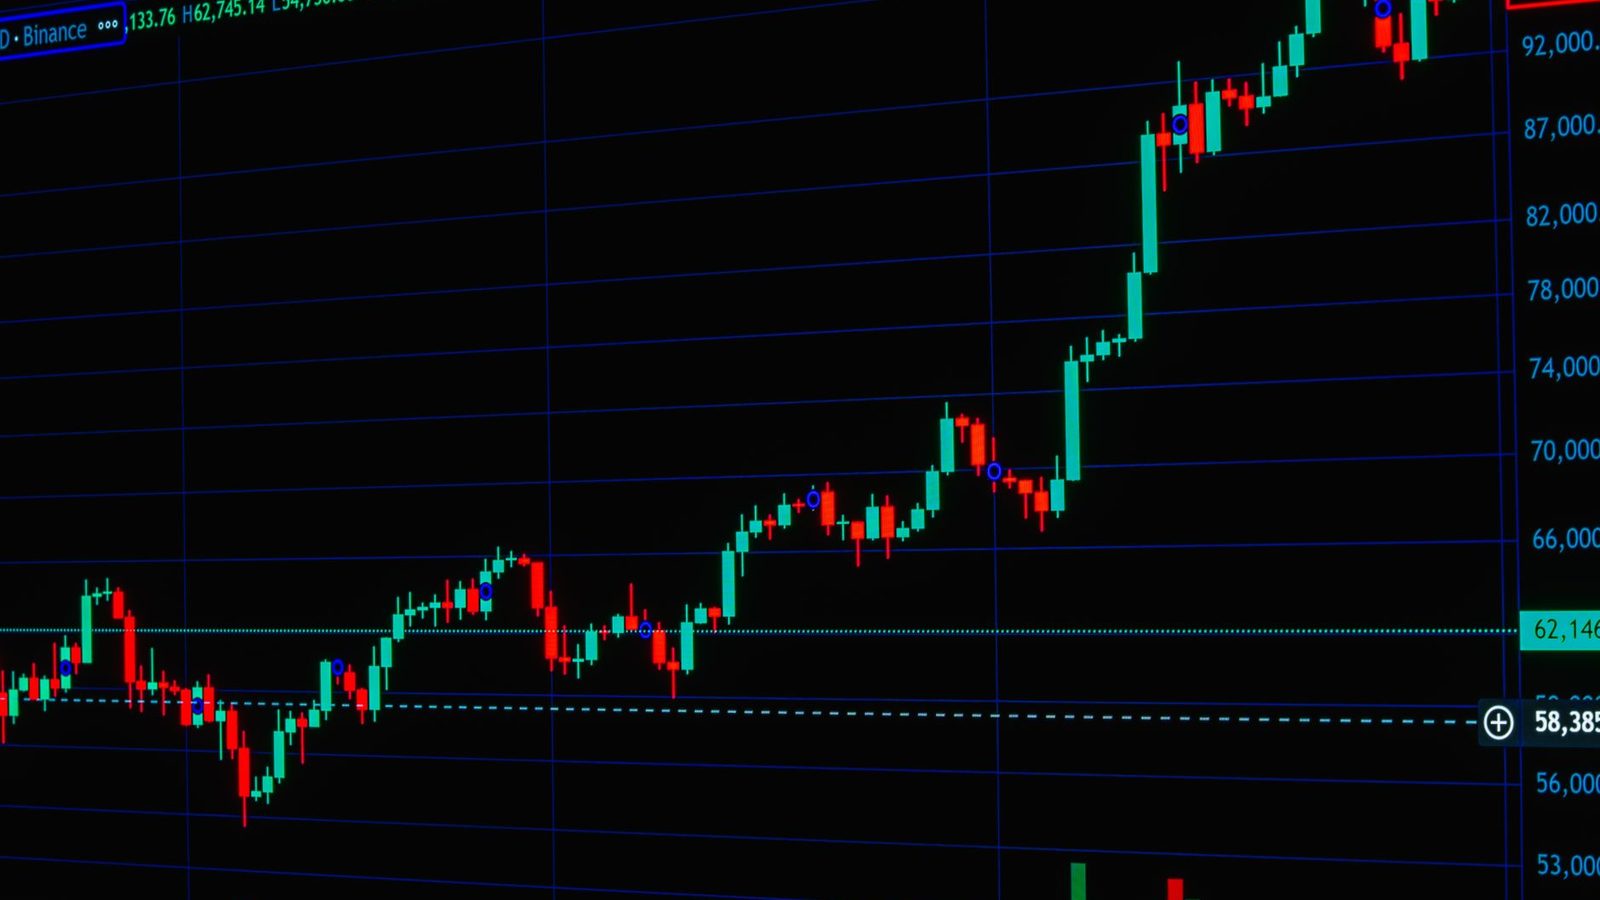
Maximum drawdown is the largest peak-to-trough decline a portfolio experiences over a given period, expressed as a percentage. It measures how much capital was lost from the highest point before a new high was reached, making it one of the most direct measures of downside risk.
Maximum drawdown (MDD) is the single most revealing number in a risk manager's toolkit. It tells you the worst loss a portfolio suffered from its highest recorded value to its lowest point before recovering, expressed as a percentage of that peak. If your portfolio grew to $200,000 and then fell to $140,000 before climbing again, your maximum drawdown was 30%. That one figure communicates something a standard deviation or a Sharpe ratio cannot: how bad it actually got, in real money terms, for the investor sitting through it.
How Maximum Drawdown Is Calculated
The formula is straightforward. You identify the highest portfolio value achieved up to any point in time (the peak), then find the lowest value reached after that peak before a new high is set (the trough). The calculation is:
Max Drawdown = (Trough Value - Peak Value) / Peak Value
Because the trough is always lower than the peak, the result is always a negative number or zero. Convention presents it as a positive percentage for readability, so a result of negative 0.30 becomes a max drawdown of 30%.
The subtle part is that you are looking for the maximum such decline across the entire history. A portfolio might have several drawdown episodes. Maximum drawdown picks the deepest one. This matters because investors often underestimate how bad their worst period was when they only look at annual returns.
In my own work running a delta-neutral volatility strategy, we track drawdown on a daily basis, not monthly. Volatility strategies can lose money very quickly during sudden market dislocations, so waiting until the end of the month to assess damage is far too slow. Daily monitoring means we can react to deteriorating conditions before a manageable drawdown becomes a career-ending one.
Why Maximum Drawdown Is a Capital Protection Metric
Growth metrics tell you what you earned. Drawdown metrics tell you what you risked losing. Those are fundamentally different conversations, and risk management lives in the second one.
Consider two portfolios that both return 12% annually over five years. Portfolio A's maximum drawdown is 8%. Portfolio B's maximum drawdown is 42%. They look identical on a returns scorecard, but they are completely different risk propositions. Portfolio B required its investors to watch nearly half their capital disappear at some point. Many would have sold near the bottom, locking in the loss permanently and never participating in the recovery. The arithmetic of compounding punishes large drawdowns severely: a 50% loss requires a 100% gain just to break even.
This is why drawdown sits in the capital protection section of any rigorous risk framework, alongside position sizing, tail risk controls, and ruin probability. You cannot compound your way to long-term wealth if large drawdowns periodically reset the base from which you are compounding.
Maximum Drawdown Versus Other Risk Measures
Standard deviation and Value at Risk (VaR) are the dominant risk measures in most institutional settings. Each has genuine value, but each also has limitations that maximum drawdown directly addresses.
Standard Deviation
Standard deviation measures the dispersion of returns around the average. It treats upside volatility the same as downside volatility, which is mathematically consistent but economically misleading. Investors do not experience volatility symmetrically. A month with a 10% gain followed by a month with a 10% loss feels very different from the reverse, and both feel very different from two flat months. Maximum drawdown captures the directional, sequential nature of losses in a way standard deviation cannot.
Value at Risk
VaR estimates the loss that will not be exceeded with a given probability over a given time horizon. A one-day 95% VaR of $50,000 means there is a 5% chance of losing more than $50,000 in a single day. The problem is that VaR says nothing about what happens in that 5% tail, and historical VaR models calibrated to calm periods routinely underestimate losses during crises. Maximum drawdown, by contrast, is drawn directly from lived history. It shows what actually happened, not what a model predicted might happen.
Calmar Ratio
Maximum drawdown is most powerful when used in ratios. The Calmar Ratio divides annualised return by maximum drawdown, giving you a risk-adjusted return figure grounded in real loss experience rather than statistical assumptions. A fund returning 15% annually with a 10% max drawdown has a Calmar of 1.5, a far better risk-adjusted profile than one returning 20% with a 40% max drawdown (Calmar of 0.5). In evaluating any strategy for our volatility book, the Calmar Ratio is one of the first numbers I look at.
Three Dimensions of Drawdown Risk
Experienced risk managers do not just look at the depth of a drawdown. They examine three dimensions together, because each tells a different story about the nature of the risk.
Depth
This is what most people mean when they say max drawdown: the percentage decline from peak to trough. Deeper drawdowns require proportionally larger recoveries and test investor psychology more severely. A 25% drawdown needs a 33% gain to recover. A 50% drawdown needs a 100% gain.
Duration
How long did the drawdown last? A 20% drawdown recovered in three months is a completely different investor experience than a 20% drawdown that persisted for two years. Duration matters for real-world investors who have spending needs, performance evaluation schedules, and limited patience. Funds that suffer prolonged drawdowns often face redemptions precisely when they are near the trough, forcing managers to sell at the worst moment.
Recovery Time
After the trough, how long did it take to reach a new high? This is sometimes called the time underwater. Some strategies have short, sharp drawdowns with fast recoveries. Others grind lower slowly and recover even more slowly. Recovery time determines how long existing investors are effectively earning nothing on their capital while they wait to get whole.
When I review the historical performance of any strategy, I look at all three dimensions for every significant drawdown episode. A strategy with a tolerable depth number but a two-year recovery time may be unsuitable for investors who face annual redemption gates or regular performance reviews.
How Portfolio Managers Use Maximum Drawdown in Practice
Understanding max drawdown conceptually is only half the work. The practical application is where capital protection happens.
Setting Risk Limits
Most institutional funds establish a maximum acceptable drawdown as a hard risk limit. If the portfolio breaches this level, it triggers mandatory de-risking: reducing position sizes, cutting leverage, or moving to cash. This is not an admission of failure; it is a pre-agreed circuit breaker designed to prevent a manageable loss from becoming a catastrophic one. In our volatility strategy, we define specific drawdown thresholds at which we begin scaling back net exposure and rebalancing our hedge ratios.
Position Sizing
Maximum drawdown informs how large individual positions should be. If you know that your strategy has historically produced a max drawdown of 15% in adverse conditions, and your fund's risk budget permits a 10% drawdown, then you need to size the strategy to occupy only a fraction of the total portfolio. This is where drawdown connects directly to the broader capital protection framework: sizing decisions are only rational if they are anchored to realistic loss scenarios.
Strategy Evaluation
When evaluating a new strategy or manager, I look at maximum drawdown alongside the return record. High returns generated with very high drawdowns are often the product of excessive leverage or concentrated risk taking, which may have worked in a favourable period but could be catastrophic in adverse conditions. A long track record with modest, short-lived drawdowns tells a very different story about the robustness of a process.
Investor Communication
Max drawdown is one of the most honest numbers you can share with an investor. Telling someone that a strategy returned 18% annually but at one point lost 35% of its value gives them a realistic picture of what they would have had to endure. If the investor cannot tolerate a 35% decline without selling, that strategy is wrong for them regardless of the long-term return. Matching drawdown tolerance to strategy selection is fundamental to outcomes in practice, because investors who sell at the bottom do not capture the recovery.
Common Mistakes When Interpreting Maximum Drawdown
Several misreading errors come up repeatedly, even among experienced investors.
Treating historical max drawdown as a ceiling. The worst drawdown in a backtest is the worst drawdown that occurred in the tested period. Future market conditions can and do produce worse outcomes. Using historical max drawdown as if it represents the maximum possible loss is a dangerous form of recency anchoring. Always stress-test against scenarios that exceed historical experience.
Ignoring the path to the trough. Two drawdowns can share the same depth but have very different paths. A straight-line decline of 20% over two weeks is operationally very different from a slow grind of 20% over eighteen months. The former leaves little time to respond; the latter may trigger redemptions and structural pressures that make managing the portfolio harder.
Evaluating max drawdown in isolation. A 15% max drawdown is excellent in the context of a strategy targeting 20% annual returns. It is less impressive in the context of a strategy targeting 4% annual returns. Always pair drawdown figures with the return context and the time horizon over which they were measured.
Confusing gross and net drawdown. Fees, transaction costs, and financing costs all affect the actual drawdown experienced by an investor. A strategy may show an 18% gross drawdown in backtesting but deliver a 22% net drawdown in live trading once all costs are included. Always scrutinise whether drawdown figures presented by a manager are gross or net of all fees and expenses.
Maximum drawdown is not a perfect metric, but it is an honest one. It does not rely on distributional assumptions or model parameters. It simply shows you how deep the hole got. For anyone responsible for protecting capital, that directness is exactly what the job requires.
Frequently Asked Questions
What is a good maximum drawdown for a portfolio?
There is no universal answer because it depends entirely on the portfolio's return target and the investor's risk tolerance. As a general benchmark, equity-focused portfolios typically see max drawdowns of 20% to 50% during severe bear markets. Many institutional funds target a max drawdown below 20%, while more conservative balanced portfolios aim for less than 10%. The key test is whether the drawdown is proportionate to the returns being generated, which is what the Calmar Ratio measures.
Is maximum drawdown the same as volatility?
No. Volatility measures the dispersion of returns over time, treating upside and downside moves equally. Maximum drawdown measures only the worst directional loss from a peak, capturing the sequential, compounding nature of losing streaks. A strategy can have low volatility but a severe maximum drawdown if losses cluster together, and vice versa. They measure related but distinct aspects of risk.
How does maximum drawdown relate to position sizing?
Directly and importantly. If you know a strategy's historical maximum drawdown and you have a defined loss limit for your overall portfolio, you must size the strategy so that its worst historical loss stays within your budget. For example, if a strategy has a 30% max drawdown and you can only afford a 10% portfolio-level loss from this allocation, you should allocate no more than roughly one-third of the relevant capital to it. Ignoring this connection is a common cause of portfolios breaching risk limits.
Can maximum drawdown be negative?
Mathematically the raw calculation produces a negative number because you are subtracting a larger peak value from a smaller trough value. By convention, maximum drawdown is almost always expressed as a positive percentage. A max drawdown of zero would mean the portfolio never declined from a new high at any point during the measurement period, which is rare for any real strategy over a meaningful timeframe.
How is maximum drawdown different from a loss?
A loss simply means you have less money than you started with. Maximum drawdown specifically measures the decline from the highest point the portfolio reached to the lowest subsequent point, regardless of where you started. So a portfolio could be up 50% from inception, suffer a 30% drawdown from its peak, and still be up 5% from inception. Both figures are meaningful but they answer different questions about performance and risk.
Why do hedge funds report maximum drawdown?
Because it is one of the most investor-relevant risk statistics available, and allocators demand it. Institutional investors use max drawdown to assess whether a manager's risk-taking is consistent with their mandate, to compare strategies on a like-for-like risk-adjusted basis using ratios like the Calmar Ratio, and to model whether a fund's worst historical period would have caused them to breach their own internal risk limits. Funds that do not report it clearly raise immediate questions about what they may be obscuring.